Sales Funnel Analysis in Online Stores Using Google Analytics 4 — 2026 Guide
A sales funnel in e-commerce isn’t a buzzword from marketing courses — it’s the core working tool that shows exactly where your online store leaks revenue. At Spilno Agency we build this analysis when a client runs into conversion problems — to pinpoint the stage where traffic is leaking and decide whether adding another ad channel makes sense at all.
In this guide we share the full methodology our digital agency has used since 2023: 4 funnel stages in Google Analytics 4, conversion formulas, CR benchmarks, a ready Google Sheets template you can download as PDF/Excel or copy to Google Drive, plus an 8-step checklist and examples of how to fix bottlenecks.
The guide is based on real cases of online stores Spilno Agency has worked with in apparel, cosmetics, tools and books — the comparison of eight stores is below.
Author: Spilno Agency · Updated: May 20, 2026
1. What is a sales funnel in an online store
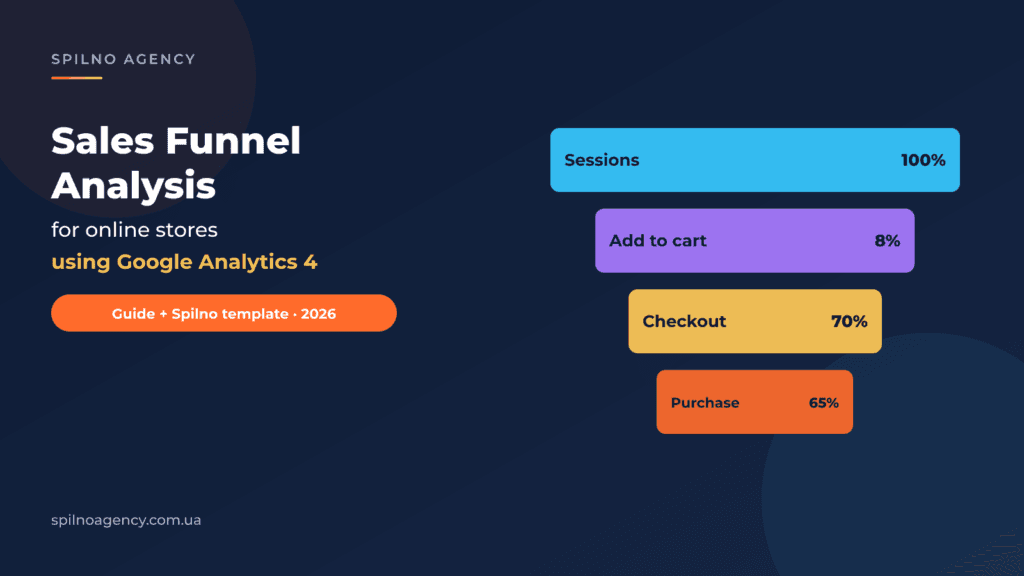
A sales funnel (conversion funnel) is a visualization of the user journey from the first site visit to a completed purchase. The classic e-commerce model has 4 stages: session → add to cart → begin checkout → purchase. The funnel describes not just traffic volume but behaviour — how many people reach each next step.
Some stores have 5–6 stages (e.g. a separate “select shipping method” or “apply promo code” step), but the analysis principle stays the same — we compare how many users move from step N to step N+1 and find the largest drop-off.
2. Why 80% of online stores analyse the funnel too late
From our experience, online stores typically start funnel analysis not before launching ads but only after 2–3 channels have already “failed to deliver”. Then the owner starts looking for the problem — and finds it inside the funnel.
Consequences: burned ad budgets (Google Ads, Meta, TikTok, marketplaces), agency fees and time. In 2026, with rising CPC and AI search, the cost of this mistake is even higher — every unprepared launch wastes 30–60% of the budget on average.
The right order: funnel audit first, ads second. At Spilno Agency we never launch paid traffic without first analysing at least 30 days of GA4 data.
3. 4 funnel stages and key events in GA4
In Google Analytics 4 each funnel stage is tied to an event. The GA4 Ecommerce standard looks like this:
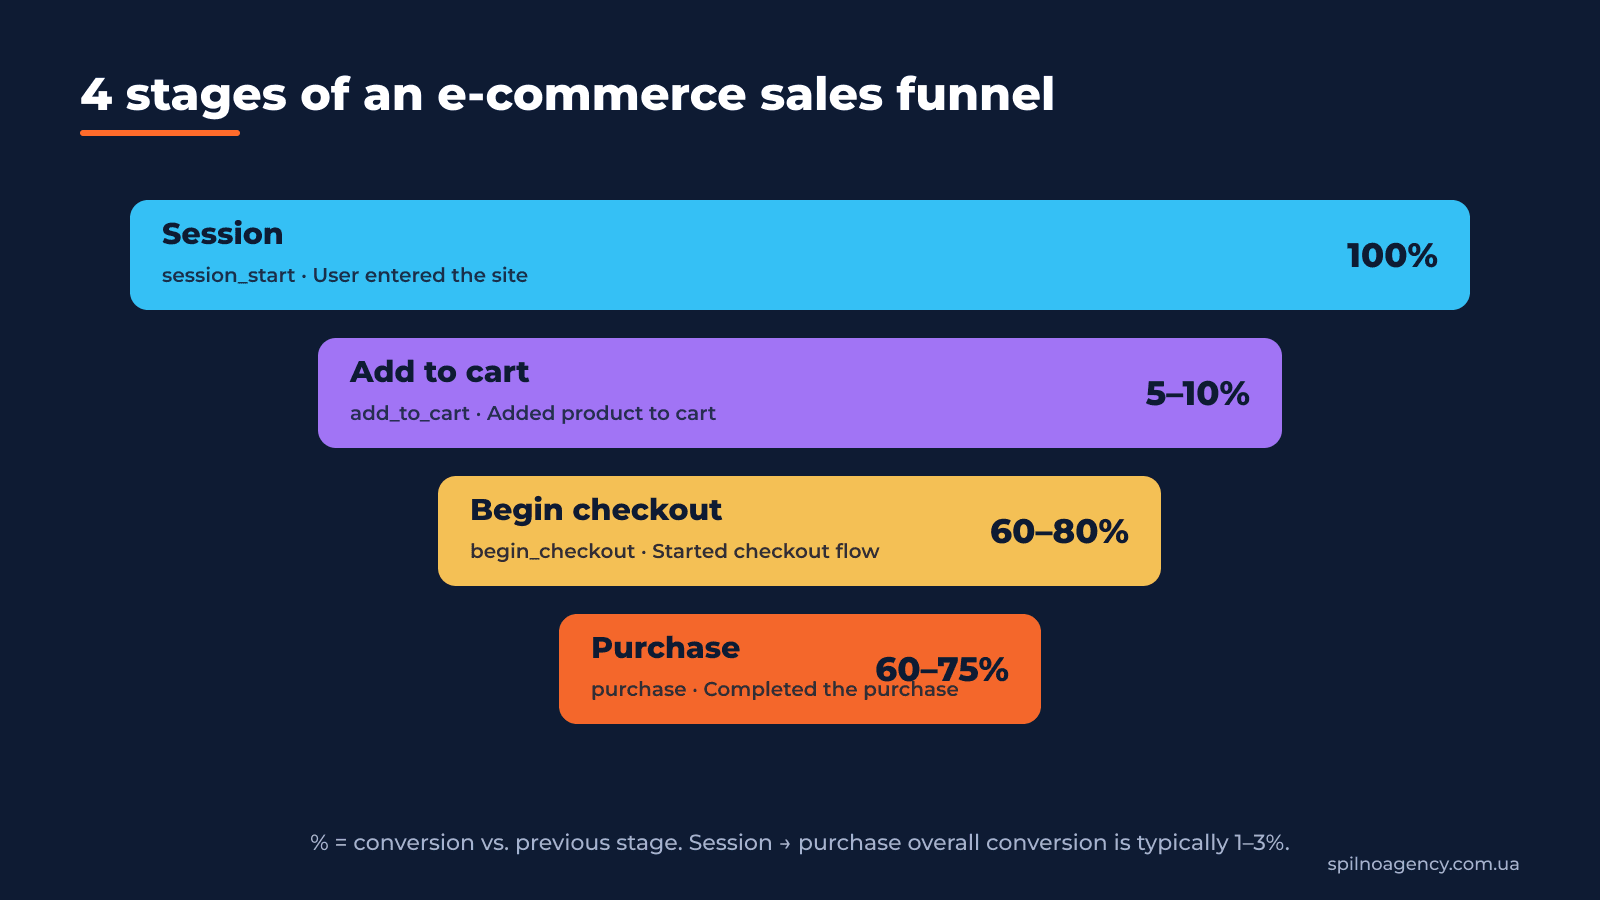
An extended funnel (for stores with variable PDPs) may include additional events view_item_list, select_item, view_item, add_payment_info, add_shipping_info. For a basic analysis 4 steps are enough.
4. Formulas and metrics for funnel analysis
Analysis is always about numbers. Without formulas you assess the funnel “by eye”, which is unacceptable. Here are 5 formulas that must be in every report:
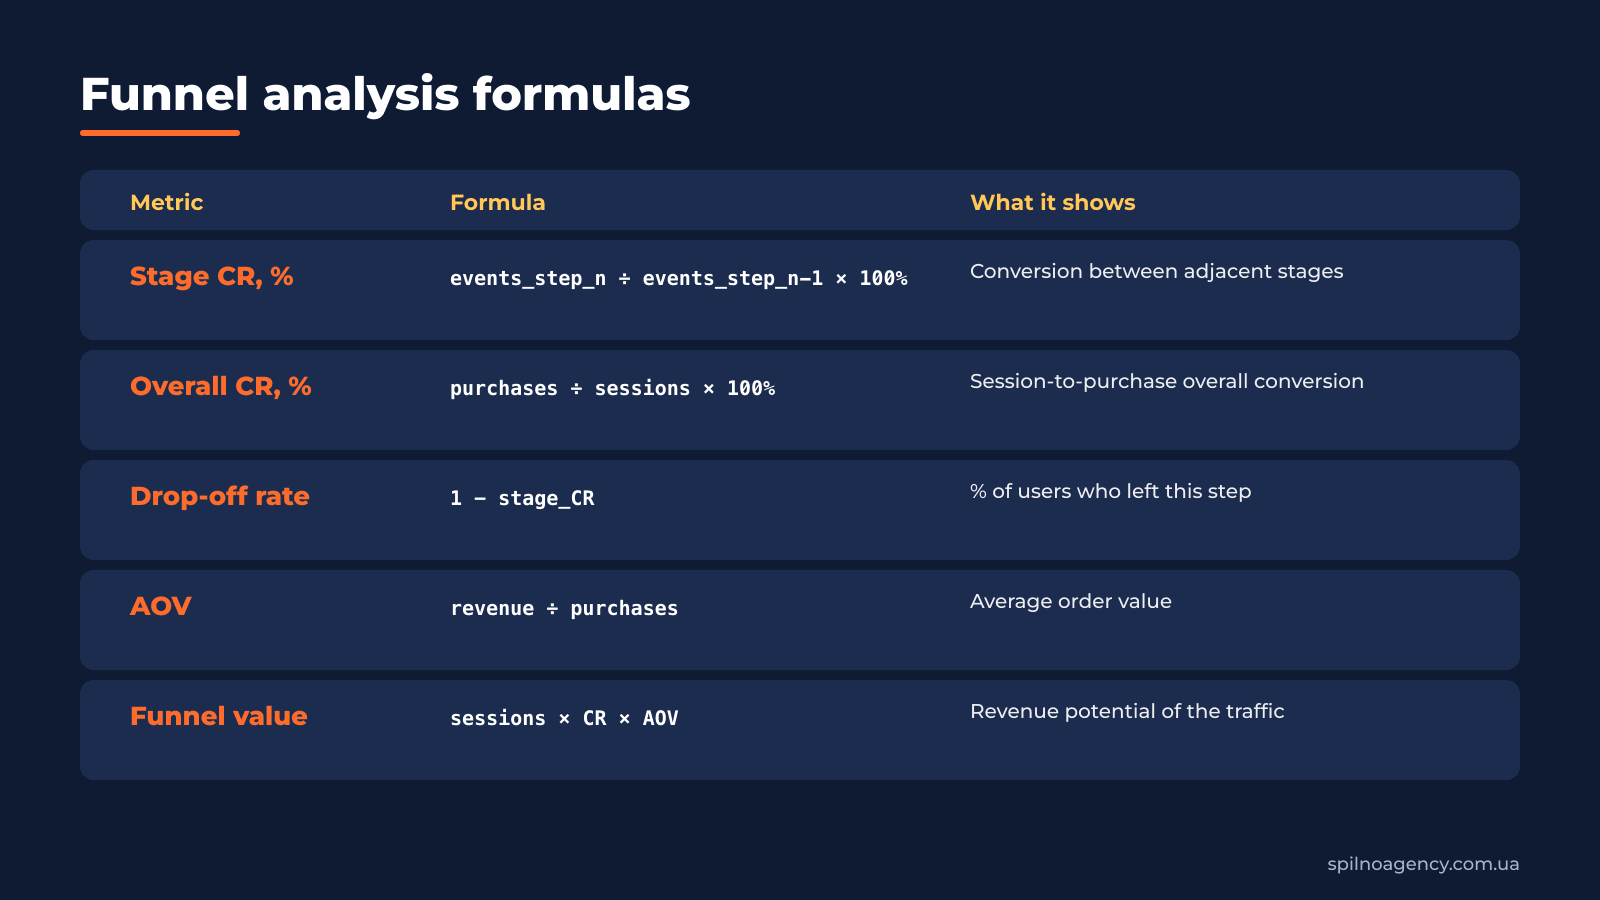
Example: in 30 days the site had 7,959 sessions, 47 add_to_cart, 34 begin_checkout, 4 purchases — Overall CR = 4/7,959 = 0.05%, while session→cart CR = 0.6%. The signal is clear: the main problem is the first stage, not checkout.
5. How to build a Funnel Exploration in Google Analytics 4
Funnel Exploration is a standard report under Explore in Google Analytics 4. Here is how to set it up:
- Open GA4 → Explore → Funnel exploration.
- In the Steps block click the pencil and add 4 steps: session_start → add_to_cart → begin_checkout → purchase. For each one choose event name with condition “Event name exactly matches”.
- In Breakdown add the dimension Source / medium or Default channel group to compare conversion across Google Ads, Organic, Direct, Meta.
- Set the Make open funnel toggle to off (a closed funnel shows the real sequential user journey).
- In the Variables tab pick a 30+ day window. In Settings you can switch Visualization to Trended funnel to see day-by-day dynamics.
- Export the data: three-dots menu on the report → Download → CSV/XLSX. Or just use our template (below).
Important: before building the funnel make sure
add_to_cart,begin_checkout,purchaseevents are configured with item scope (theitems[]array andvalue). Otherwise GA4 treats them as plain events and revenue numbers won’t match reality.
What a finished report looks like — three focused views of the same Funnel Exploration from a real e-commerce project (the property name is masked as «Client property»):


6. How Spilno Agency analyses a funnel — methodology and example
Our analysis methodology is built on 3 principles: data → benchmarks → growth points. Here is what it looks like on a real case of an auto-accessories store (period June 2025, 30 days of data):
Before moving numbers into Google Sheets, we build a Funnel Exploration report in GA4 with 5 steps (session_start → view_item → add_to_cart → begin_checkout → purchase) and a breakdown by Default channel group. Here is what a finished report looks like for one of our e-commerce clients (the property name is masked as «Client property»):

What we read from this screenshot: overall session-to-purchase CR is ~0.6% (180 purchases from 13,645 session starts). The biggest gap is step 2→3 (view_item → add_to_cart): only 97 cart-adds from 11K product views — about ~0.9% conversion rate versus a 5–15% benchmark. This is the bottleneck we then move into our Sheets template for deeper benchmark comparison.
| Store | Users | Add to cart | % | Begin checkout | % | Purchase | % | Overall CR |
|---|---|---|---|---|---|---|---|---|
| Spilno Client (all traffic) | 7 959 | 47 | 0,6% | 34 | 72,3% | 4 | 12% | 0,1% |
| Spilno Client (Google Ads + Organic) | 1 611 | 43 | 2,7% | 40 | 93,0% | 5 | 13% | 0,3% |
| E-shop 1 | 48 021 | 2 805 | 5,8% | 1 785 | 63,6% | 1 340 | 75% | 2,8% |
| E-shop 2 | 43 403 | 3 398 | 7,8% | 3 383 | 99,6% | 2 295 | 68% | 5,3% |
| E-shop 3 | 770 | 13 | 1,7% | 15 | 115% | 8 | 53% | 1,0% |
| E-shop 4 | 4 841 | 333 | 6,9% | 122 | 36,6% | 76 | 62% | 1,6% |
| E-shop 5 | 1 065 853 | 348 047 | 32,7% | 207 103 | 59,5% | 23 278 | 11% | 2,2% |
| E-shop 6 | 4 941 | 1 520 | 30,8% | 228 | 15,0% | 38 | 17% | 0,8% |
| E-shop 7 | 1 437 | 126 | 8,8% | 61 | 48,4% | 36 | 59% | 2,5% |
| E-shop 8 | 6 136 | – | – | – | – | 59 | – | 1,0% |
Example funnel analysis of the Client’s store benchmarked against 7 other stores — fragment of the Spilno Agency template. Red cells flag low values: Add-to-cart CR < 3%, Checkout/Purchase CR < 40%, Overall CR < 0.5%.
Spilno Agency conclusion: for the client 2 of 3 stages are within norms (begin_checkout → 72.3%; checkout → 12% — low-mid range). The problem is the first stage: session → add_to_cart is only 0.6% vs. 5.8–7.8% at niche competitors, which is 10× below the industry baseline. This isn’t an ads issue — it’s a PDP, pricing and trust issue.
Based on this finding Spilno Agency set 2 tasks for the client: (1) rebuild the PDP — photos, copy, reviews, price, USP; (2) audit traffic by source (8 of 10 sessions came from irrelevant traffic). Two months after the changes CR session→cart rose to 3.8%.
7. Download the funnel analysis template (PDF, Excel, Google Sheets)
We’ve shared the template our agency uses with clients. Download and use it — the structure is fully ready for a 30-day analysis benchmarked against 7 stores.

Clicking the button opens Google’s “Make a copy” dialog — the spreadsheet will be saved to your Google Drive as your own editable file, independent of our original.
8. CR benchmarks: when conversion counts as low
What counts as low, mid or high conversion? E-commerce has no universal benchmark — it depends on niche, product price and traffic type. Here are Spilno Agency reference ranges for mass e-commerce (apparel, cosmetics, accessories, home appliances):
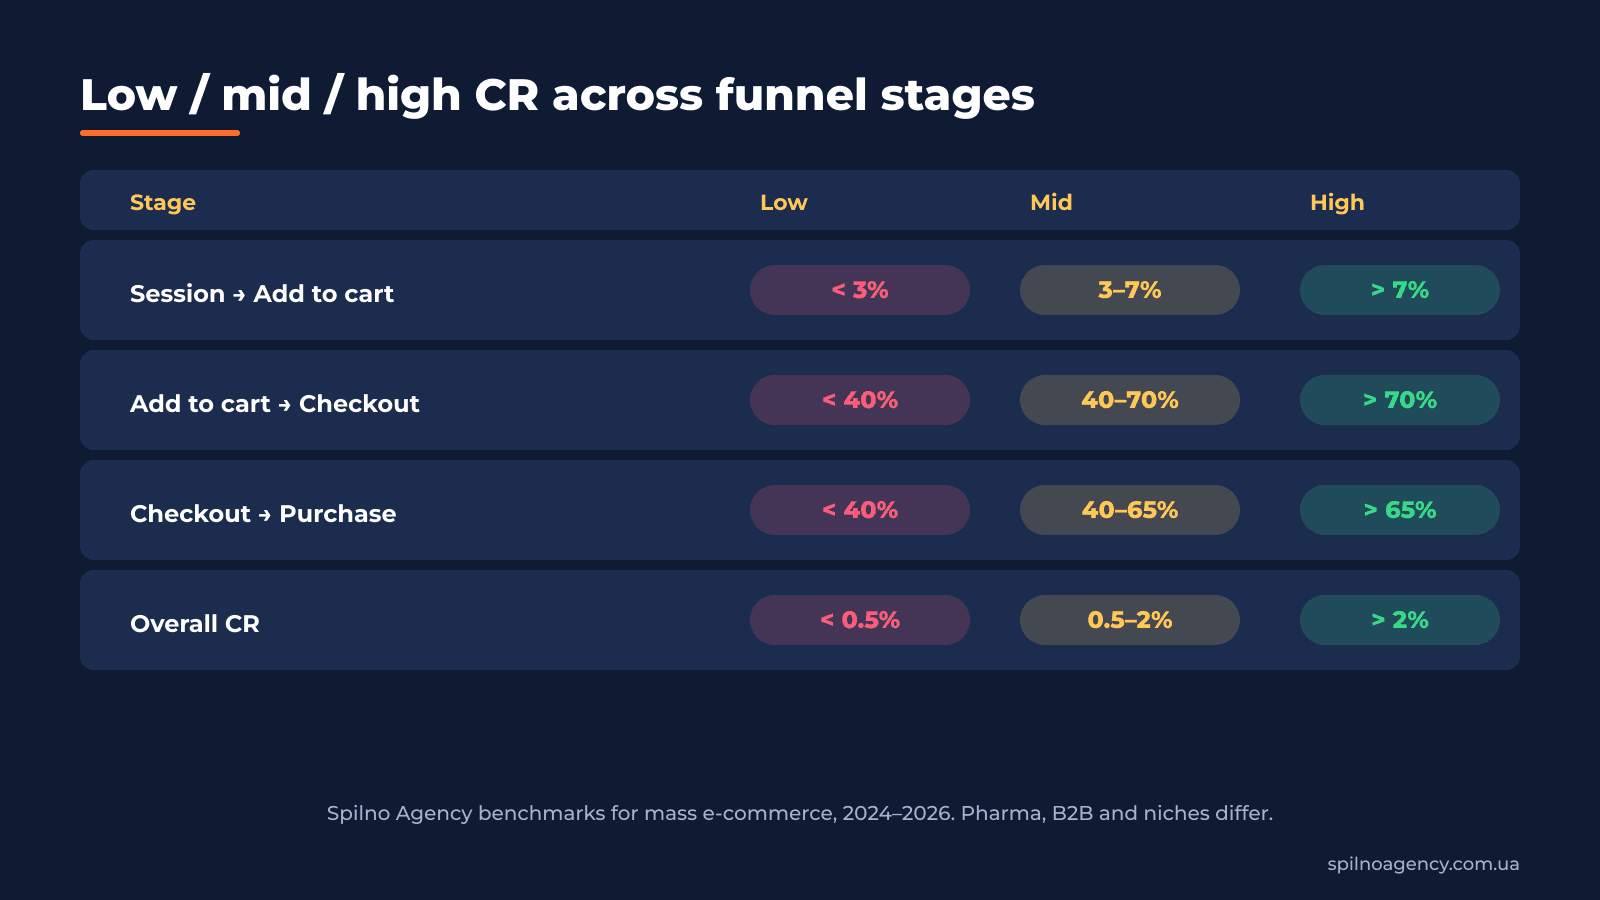
B2B and Pharma stores can hit Overall CR of 5–10%, but at much lower traffic volumes. FMCG marketplaces — 3–4%. For luxury, auto and B2B-industrial sectors a normal CR may be 0.3–0.8%.
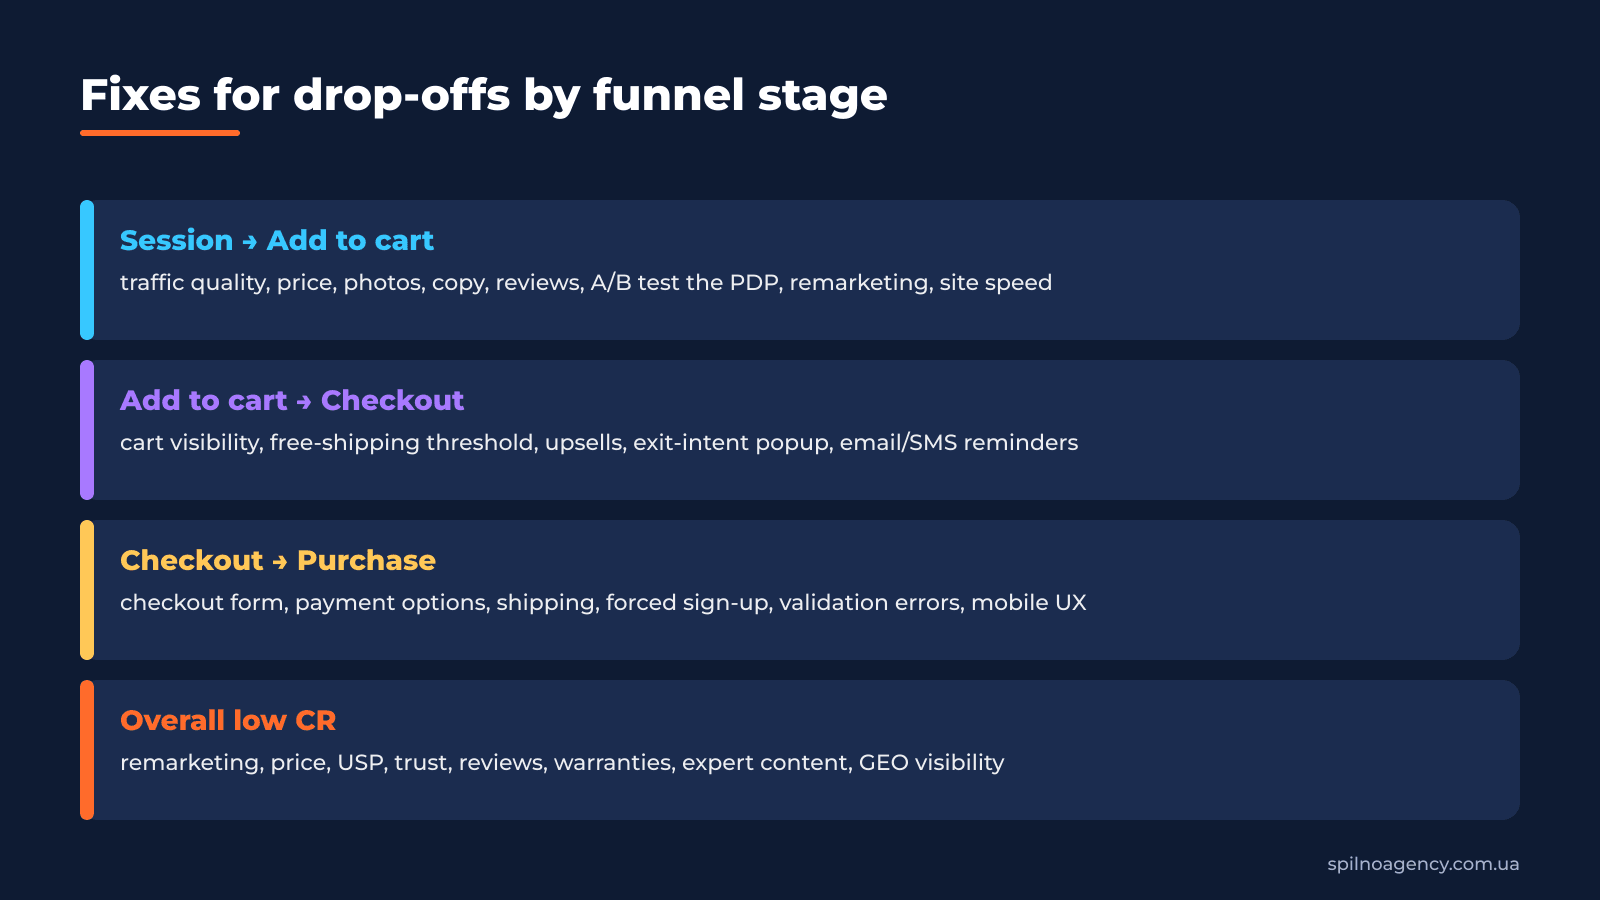
9. How to fix drop-offs at each funnel stage
Each funnel stage requires different fixes. Here is the Spilno Agency action map:
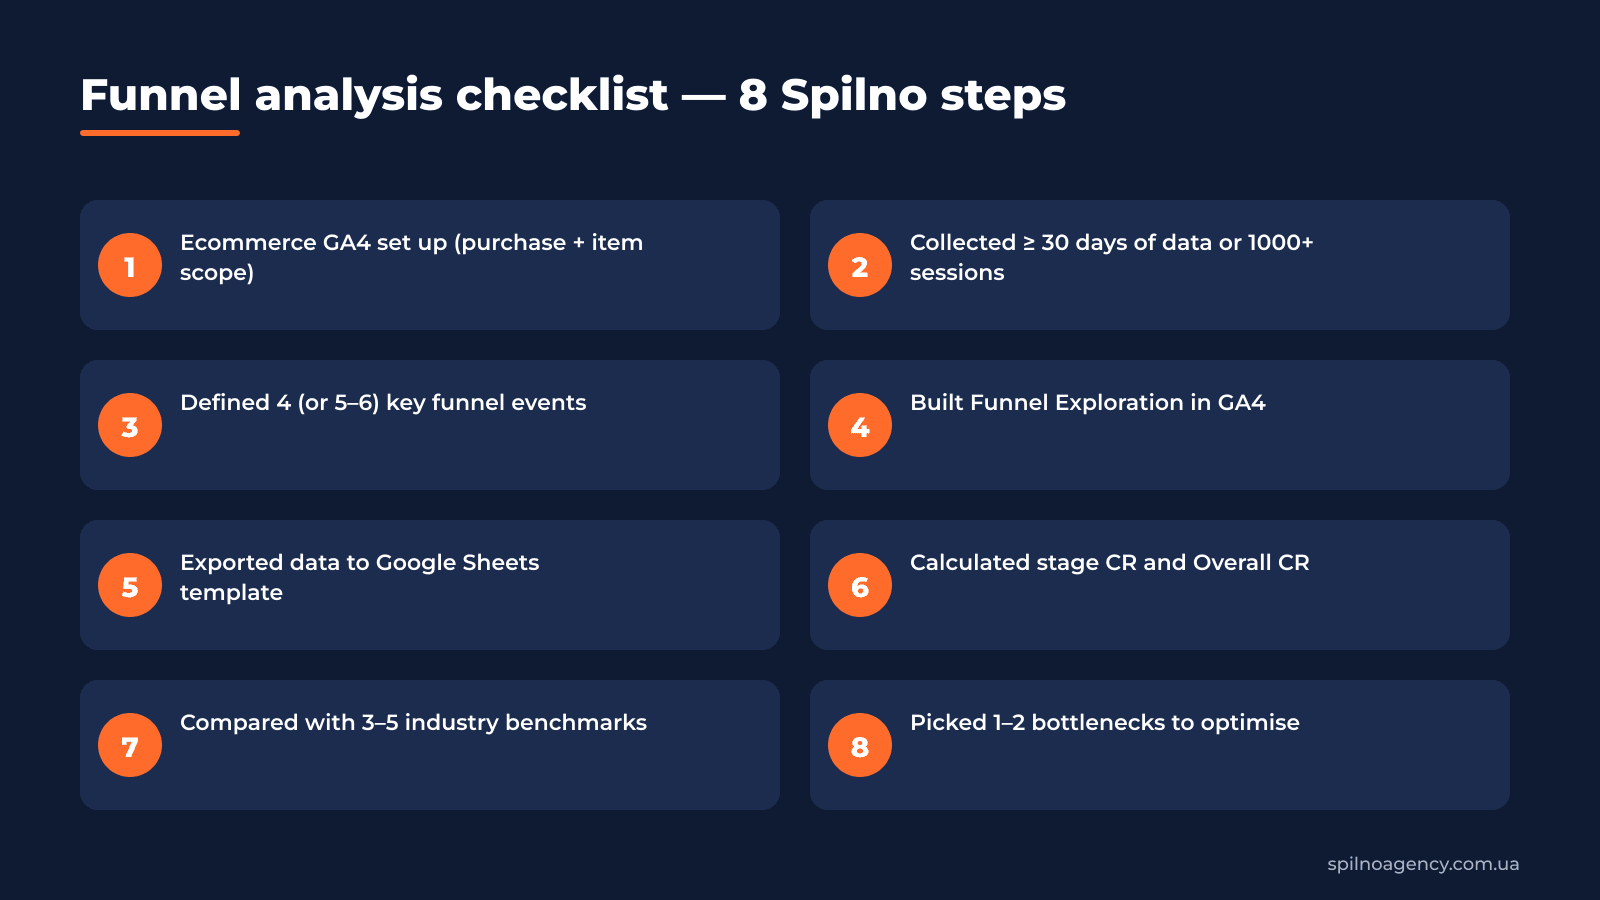
10. Funnel analysis checklist — 8 Spilno steps
We use this checklist as the definition of done for every funnel audit. If a single item is missing, the analysis isn’t finished.
11. AI Overviews, GEO and the funnel in 2026
In 2026, with the rise of AI Overviews and AI Mode in Google, search is turning into a conversation. For e-commerce this means 3 fundamental funnel changes:
- Fewer clicks — more “zero-click” traffic. AI Overviews answer queries on the SERP. The funnel shifts downward: visitors who reach the site have higher intent → session→cart CR can rise.
- Brand search instead of generic. Users ask AI “which store is best for X” and then click a specific brand. This makes brand trust, reviews and Google Merchant Center more important.
- Shopping Graph and structured data. GA4 in 2026 deepens integration with Google Shopping. If your Merchant Center feed isn’t optimised, a part of the funnel simply doesn’t exist for AI.
Spilno recommendation: integrate GA4 with Google Ads, Merchant Center and Search Console, and add view_promotion / select_promotion events to track AI-snippet impact on the funnel.
12. 7 common funnel-analysis mistakes
In 5 years of working with e-commerce clients we’ve collected 7 typical mistakes that invalidate any funnel analysis:
- Funnel based on < 7 days of data. Not representative. Use 30+ days or 1000+ top-stage sessions.
- No traffic-source segmentation. Overall CR hides that Google Ads converts at 3% and Direct at 0.1%. Those are different funnels.
- Ignoring mobile vs. desktop. Mobile CR is usually 2–3× lower, and 60% of issues hide there.
- Relying only on purchase, skipping add_to_cart. If the issue is on the top stage you’ll only catch it via mid-funnel events.
- No benchmark comparison. CR 1% means nothing alone — it’s good or bad only in context.
- One-off analysis with no follow-up. The funnel is a living system. Repeat the audit monthly or quarterly.
- Analysis without an action plan. If the report doesn’t end with 1–3 concrete tasks, it’s useless.
If you need a full funnel audit, Ecommerce GA4 setup or an e-commerce growth strategy, contact Spilno Agency. We’re a ROI-driven digital agency building funnels that actually make money.
FAQ
What is a sales funnel and why analyse it?
A sales funnel visualizes the user journey in e-commerce from session to purchase. Analysis reveals exactly where the store loses traffic: on the product page, in the cart or at checkout. Without it, advertising is running blind.
How do I build a funnel in Google Analytics 4?
Use the Funnel exploration report under Explore: add 4 steps (session_start, add_to_cart, begin_checkout, purchase), set a 30+ day window and Source / medium breakdown. Export to Google Sheets for analysis.
What is a normal e-commerce funnel conversion rate?
For mass e-commerce Overall CR (session → purchase) is normally 0.5–2%. CR session → add_to_cart — 3–7%. CR add_to_cart → begin_checkout — 40–70%. CR begin_checkout → purchase — 40–65%. Luxury, B2B and Pharma differ.
How much data do I need for funnel analysis?
At least 30 days or 1000+ sessions at the top stage. Less than that and the data jumps around from random purchases, leading to wrong conclusions.
Can I analyse a funnel without the Google Sheets template?
You can, but it’s painful. The Spilno template already contains the comparison with 7 stores and a conclusion block. Download PDF/Excel or copy it to your Google Drive (links above).
How often should I audit the funnel?
Monthly for active stores running ads. Quarterly for stable ones. Mandatory after each release or A/B test.
This article is part of a free course:
Google Analytics Course
To unlock the quiz after this article and track your progress, sign up (or sign in) and start the course in your personal dashboard.
Knowledge Test
You get only 1 attempt at this quiz — read every question carefully before answering. You need at least 80% correct answers to pass.
Read also
Spilno Agency’s Experience: How We Verify Events Before Starting Work
Before launching a campaign in Google Ads or Meta Ads, or starting SEO work, Spilno Agency always checks…
GA4 DebugView: How to Verify Google Analytics Events in Real Time
DebugView is the section of Google Analytics 4 that shows your site’s events in real time, seconds after…

Top Claude Skills for TikTok Ads Specialists (2026)
9 verified Claude skills and MCP servers for TikTok Ads: Pixel/Smart+ audits, Spark Ads hook/hold rate, creator sourcing,…