Google Search Console now shows your branded traffic: the new «Branded traffic» report
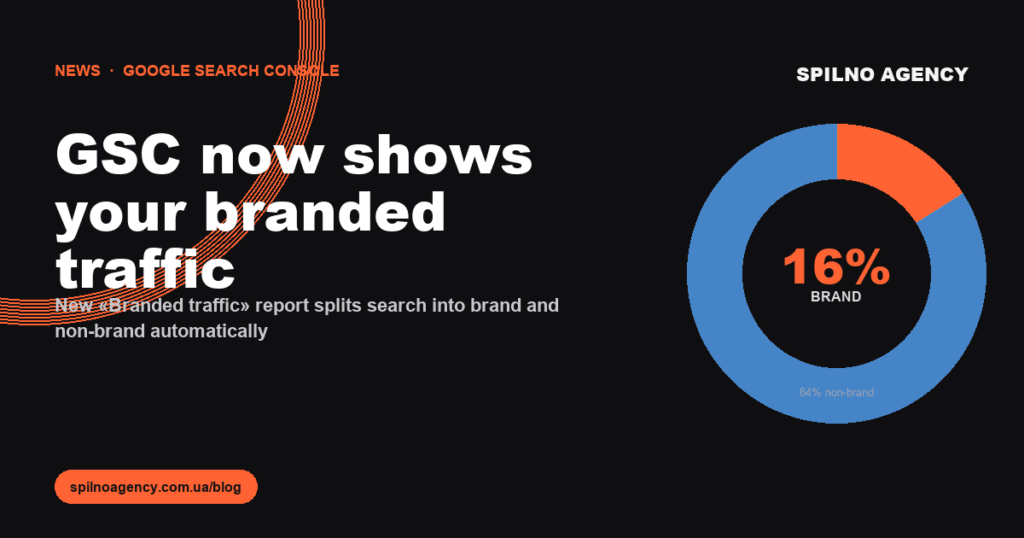
Google Search Console has rolled out a new Performance widget — «Branded traffic». It splits all of your search traffic into two buckets: queries containing your brand name and everything else — and it does this even for queries Google normally hides for privacy reasons. For SEO teams, this is the first time the «people who already know us vs people who find us» split is one click away, no regex required.
What’s new
Until now, brand share had to be reconstructed manually — build a regex filter in Performance (e.g. brand|brandname|brand co), subtract from the total, and guess about anonymized queries — those Google hides when results contain personal or rare data. Anonymization typically understates branded traffic by 30–60%.
The new report uses Google’s internal signals (the brand entity in Knowledge Graph, navigational patterns to your domain, query co-occurrence) and counts all hits, anonymized included. That’s a level of accuracy you can’t reach with manual regex.
Where to find it
- Open Google Search Console.
- Go to Performance → Search results.
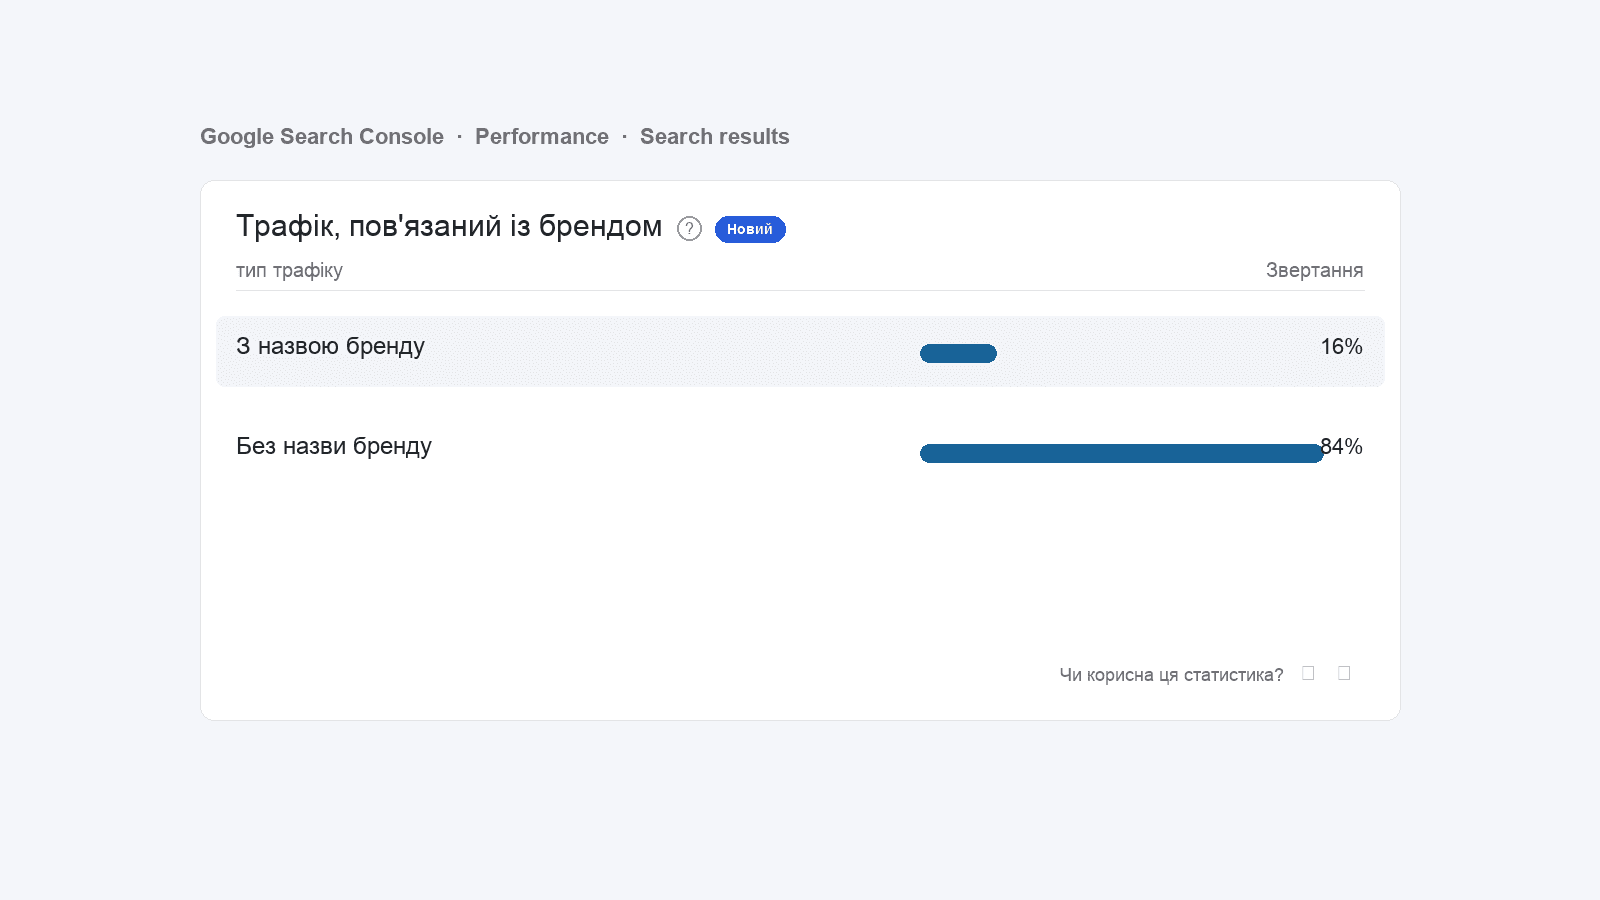
- Scroll past the main chart and queries table.
- Look for the «Branded traffic» card with a «New» tag.
Google is rolling this out in waves — if it’s not in your account yet, give it a couple of weeks. It appears for both Domain and URL-prefix properties as long as you have enough search volume.
How Google decides a query is «branded»
Google doesn’t publish the exact formula, but the report leans on three things:
- Brand entity in Knowledge Graph — Google knows your business as a named entity (domain, legal name, transliterations).
- Behavioral patterns — queries after which users consistently navigate to your domain.
- Anonymized queries — Google can label an anonymized query as branded internally, even when the string itself isn’t shown publicly.
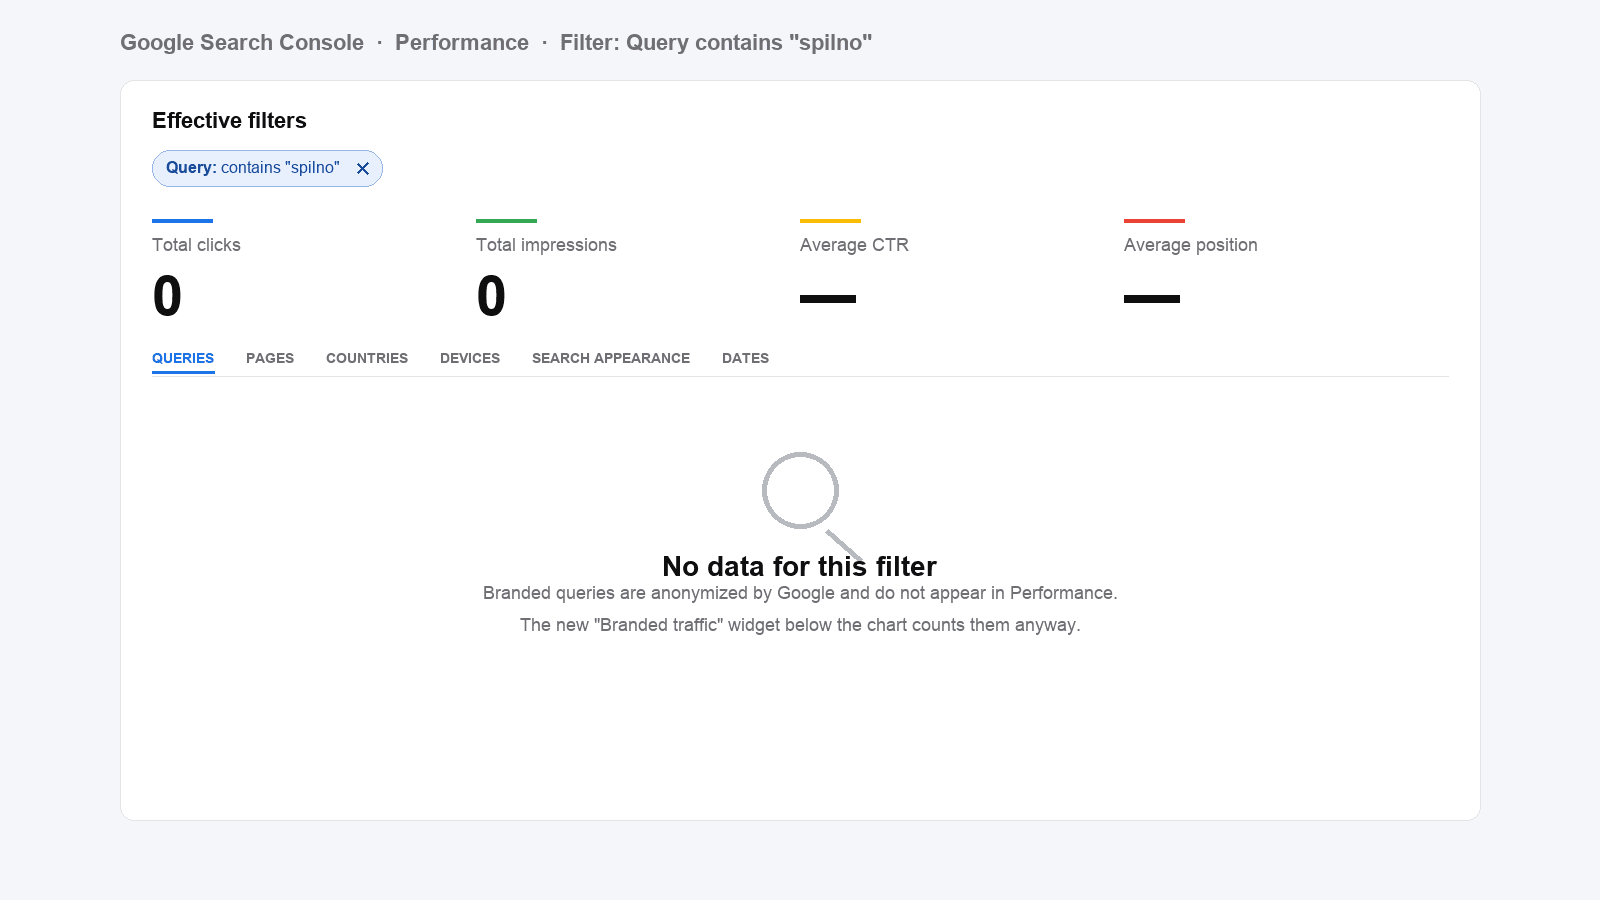
A live example from our own account: filter Query contains "spilno" in Performance and you get 0 clicks. The new branded widget in the same account shows 16%. The gap is exactly the anonymized branded zone that used to be invisible.
How to read the numbers
- Brand — users who already know you. Direct name lookups, domain-as-keyword search, misspellings, return visits.
- Non-brand — users searching for a problem, service or question and finding you through SEO. A clean indicator of content strength and ranking positions.
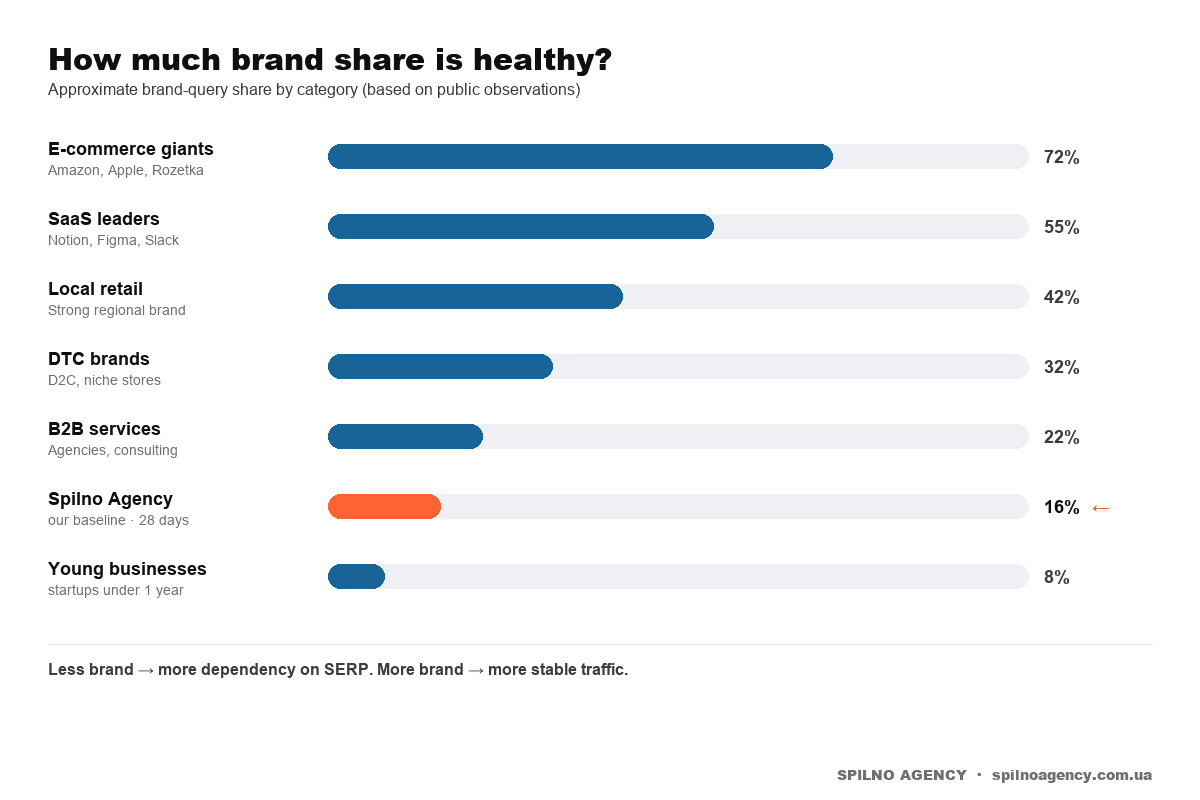
A healthy ratio depends on category. Rough benchmarks:
5 ways to use the report
1. SEO lead: a clean non-brand baseline
The «Non-brand» row is now your ready-made SEO growth metric. If non-brand clicks rise while positions hold, your ranking pages are pulling in new demand. If they drop — check for lost positions or cannibalization between brand and non-brand pages.
2. Brand marketer: ROI of awareness campaigns
OOH, TV, PR, influencers, podcasts, conference talks — all should bump branded share within 2–6 weeks of peak activity. Now you can see the lift on one chart, no UTMs, no post-campaign survey, no analyst.
3. PR team: audience reaction to coverage
A Forbes feature, a CEO interview, a crisis post — measure the impact through weekly branded-search dynamics. Especially useful in crises: a sharp branded-search spike means people are looking for your side of the story.
4. Performance marketer: overlap with Google Ads
If you bid on your own brand keywords in Google Ads, compare your organic brand share with paid brand impressions. If organic already covers the demand, your brand-PPC budget may have near-zero incremental lift. A classic experiment that’s now trivial to set up.
5. CEO & founder: brand health-check without an analyst
One chart — no BI, no SQL, no team coordination. The trend of brand share over time is a reading on brand strength in the market. Going up means more people are talking about you, searching for you, returning. Going down means it’s time to invest in positioning.
The Spilno method: brand → click → conversion
At Spilno Agency we audit marketing through a stage-by-stage funnel: where does the anomaly sit, which stage is on benchmark, which one isn’t. Same logic applies to branded traffic.
| Stage | What we measure | Healthy benchmark | What to do on anomaly |
|---|---|---|---|
| 1. Branded demand | Brand share in GSC | 10–30% for B2B services, 30–60% for established brands | Below 10% → invest in awareness; above 60% → diversify SEO |
| 2. Brand click | CTR on branded SERPs | ≥ 50% (brand SERP is usually clean) | Low CTR → check competitor bids, trademark squatters |
| 3. Brand conversion | CR from branded sessions (GA4) | ×3–5 vs non-brand | Lower? Trust signals or UX gap on key pages |
Stage-1 anomaly (low brand share) means demand isn’t formed yet — SEO is doing all the work. Stage-2 anomaly means competitors or resellers are intercepting your brand SERP. Stage-3 anomaly means your brand promise doesn’t match the landing experience.
What to do today
- Open GSC, find the widget and screenshot it — that’s your baseline.
- If you have multiple properties, compare brand share between the main site and subdomains/locales.
- Add brand share to your monthly SEO report. The KPI is YoY growth in non-brand clicks at a stable (or controlled) brand share.
- If you’re planning a brand campaign, lock the current share as the «before» mark.
- If brand share is < 10% and the business is over 2 years old — that’s a conversation to have with leadership about awareness strategy.
FAQ
Is the report available for every site?
Google rolls features in waves. If your account doesn’t show it yet, check again in a week. Very small sites (under ~100 monthly clicks) may never get it because of statistical thresholds.
Can I pull this through the API?
As of 2026-05-04, the Search Console API does not expose the brand split. UI only for now. We expect the field to land in the Search Analytics API in the coming months.
How is this better than a regex filter?
Regex only sees visible queries — but Google anonymizes 50–60% of long-tail queries. The new widget uses Google’s internal signals to cover that dark zone. On spilnoagency.com.ua, regex returned 0; the widget shows 16%.
Does it affect rankings?
No. It’s a new report, not an algorithm change. But it changes how you make decisions about SEO and brand investment — and that does affect rankings on a longer horizon.
Bottom line
Search Console finally splits organic into «people who know us» and «people who find us» on one chart. SEO teams: time to refresh the monthly report template. CEOs: a simple brand-strength tracker. Agencies: a new KPI line for client work. Check your account today — and lock the baseline before competitors notice the report.
If you need an outside perspective on the structure of your branded vs non-branded traffic, the Spilno Agency team runs SEO audits and quarterly organic strategies.
Read also
AI Overviews: What They Are and How to Get Featured in 2026
AI Overviews are Google's Gemini-powered AI summaries in search. What they are, how they work, and what it…
BANT Lead Qualification Methodology: What It Is and How It Works
BANT is a lead qualification framework built on four criteria: Budget, Authority, Need, Timeline. What it is, example…
Best Claude Skills for Threads (2026)
Claude skills and MCPs for Threads: posts and threads, captions, carousel design, cross-posting from Instagram, the official Threads…