How to Read the User Loyalty Report in Google Analytics 4
The User Loyalty report in Google Analytics 4 shows stickiness — how often your audience comes back to the site. The three lines on the chart are the DAU/MAU, DAU/WAU and WAU/MAU ratios. This guide explains what each line means, how to read specific values, which numbers count as good, and why you should always ignore the last points on the chart.
What the User Loyalty report is in Google Analytics 4
User Loyalty is a chart card in Google Analytics 4 that shows stickiness — how «sticky» your audience is. In plain terms, it answers one question: how regularly do people come back, instead of visiting once and disappearing for good.
Unlike total users or sessions, loyalty is measured not in absolute numbers but in percentage ratios. The chart has three lines, and each one is a separate ratio of active users across different time windows.
An «active user» in GA4 is not just any visitor, but one who had an engaged session: spent more than 10 seconds on the site, viewed 2+ screens, or triggered a conversion event.
Stickiness in plain words
Stickiness is a return metric. The higher the percentage, the more loyal the audience: people are used to the product and come back again. The classic stickiness formula is the ratio of daily to monthly users:
Stickiness (DAU/MAU) = Daily Active Users (DAU) / Monthly Active Users (MAU) × 100%Where: DAU — Daily Active Users, WAU — Weekly Active Users, MAU — Monthly Active Users. The GA4 report shows three ratios of these values at once.
The three chart lines: DAU/MAU, DAU/WAU and WAU/MAU
The main difficulty is that the legend labels in the interface are often truncated. Here is what each line means by colour and meaning:
| Line | Ratio | What it shows |
|---|---|---|
| 🔵 Blue | DAU/MAU | What share of the monthly audience visits daily |
| 🟢 Green | DAU/WAU | What share of the weekly audience visits daily |
| 🟣 Magenta | WAU/MAU | What share of the monthly audience visits weekly |
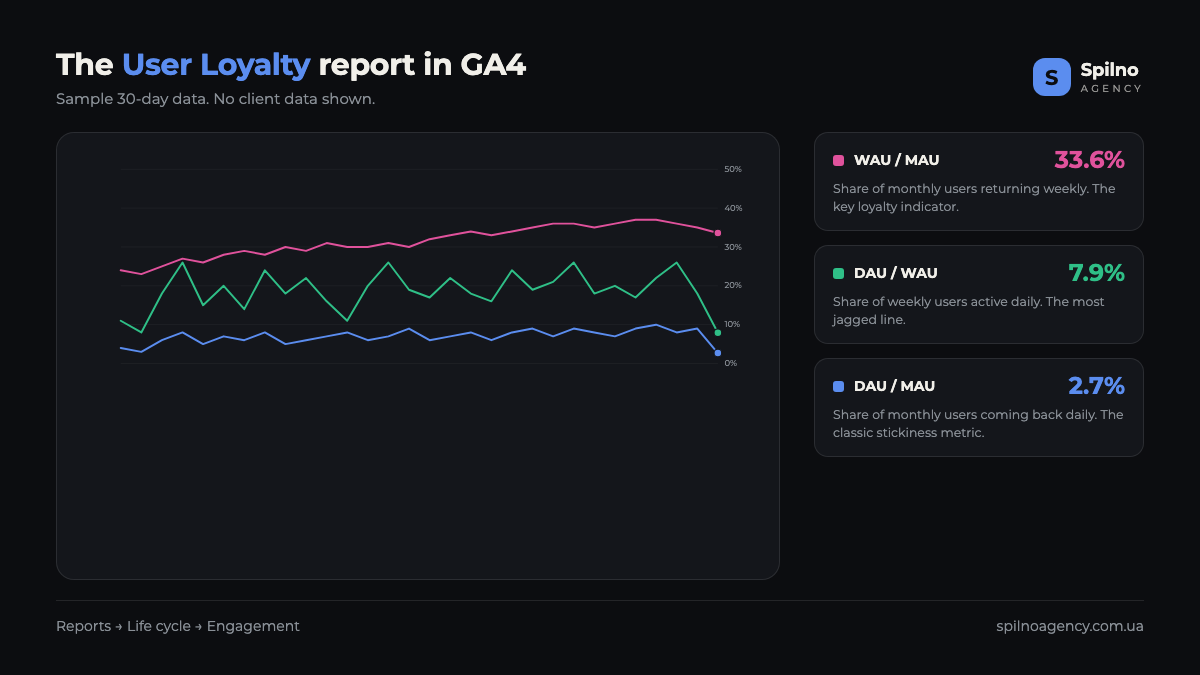
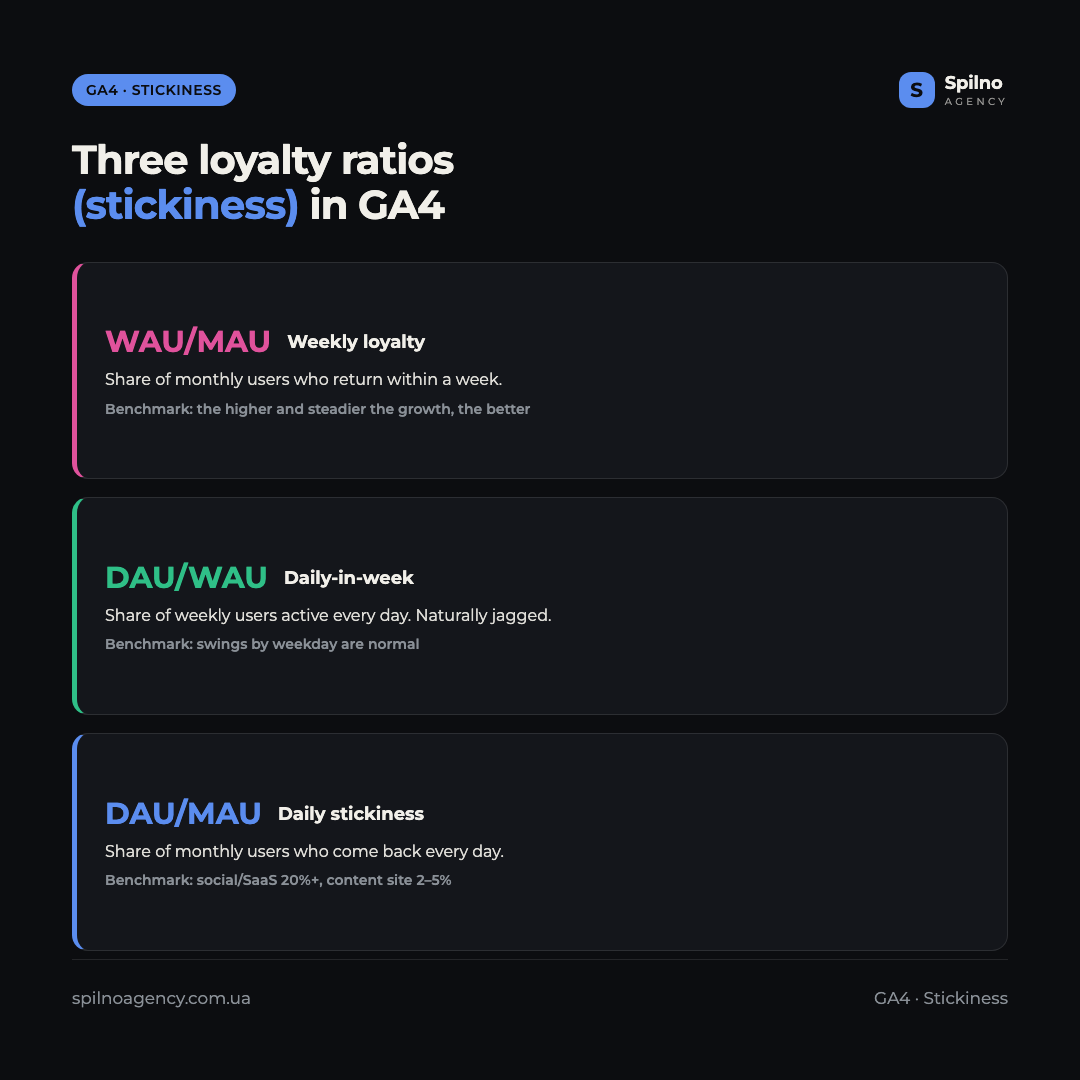
The magenta line (WAU/MAU) almost always runs highest, the blue one (DAU/MAU) lowest, and the green one (DAU/WAU) sits in the middle and swings the most. This is the normal, expected order of the lines for most sites.
How to read specific chart values
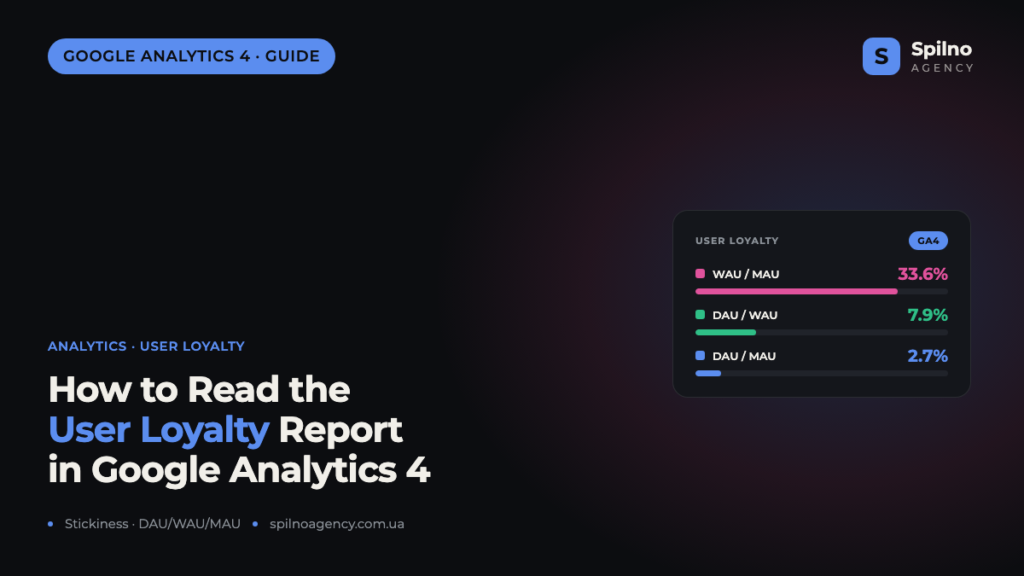
Let’s use real values as an example: DAU/MAU = 2.7%, DAU/WAU = 7.9%, WAU/MAU = 33.6%.
- WAU/MAU 33.6% — a third of the monthly audience returns within a week. A good signal: people are not one-off visitors, they come back over the week.
- DAU/MAU 2.7% — only ~3 out of 100 monthly visitors come back daily. For a content site or blog this is normal — there is no need to read a blog every day.
- DAU/WAU 7.9% — the link between daily and weekly activity. It shows how «spread out» activity is within the week.
Important: read these three numbers together, not separately. A low DAU/MAU with a high WAU/MAU is a typical, healthy profile for a content site: no reason to visit daily, but a third of the audience returns over the week.
Which loyalty values count as good
There is no single «good» stickiness number — the benchmark depends heavily on the business type. The logic is simple: the more reasons to visit daily, the higher DAU/MAU should be.
- Blog, media, content site: DAU/MAU 2–5% is normal. Daily returns are not expected.
- E-commerce: DAU/MAU 5–10%. People visit in a purchase cycle, not every day.
- SaaS, work tools: DAU/MAU 15–25%. The product is used in a daily workflow.
- Social networks, messengers, games: DAU/MAU 20–50%+. The daily habit is the core of the model.
A WAU/MAU above 30% is considered a good retention figure for almost any site. And the key criterion is not the number itself, but its trend over time.
How to read the chart trend
Loyalty is a metric in motion. Look not at a single point, but at the direction of the lines across the whole period:
- Magenta (WAU/MAU) rising — the audience is becoming more loyal, weekly returns are growing. This is the most important positive signal.
- Green (DAU/WAU) heavily jagged — this is normal, not a glitch. Daily activity swings with weekdays and weekends: B2B traffic drops on weekends and rises on workdays.
- All lines drop at the very end — this is almost always an artefact of incomplete data for the last days, not a real decline in loyalty.
The last-points rule: always ignore the last 1–2 days of the chart. Today’s data (and often yesterday’s) is not fully collected yet, so the ratios are artificially low and the lines «dip». This is no reason to panic.
Common mistakes when reading the loyalty report
- Treating the end-of-chart dip as a decline. It is incomplete data for the last days, not a real drop in retention.
- Comparing your DAU/MAU with social networks. 3% is normal for a blog; expecting 20% like a messenger is a reading error.
- Looking at one point instead of the trend. Loyalty is judged by the direction of the lines over time, not by a value on one day.
- Confusing loyalty with traffic. You can grow user counts, but if stickiness falls, you are pouring water into a leaky bucket.
- Ignoring the «sawtooth» of the green line. DAU/WAU swings by weekday are a natural cycle, not an anomaly to «fix».

Where to find the User Loyalty report in GA4
The loyalty card appears in the engagement overview. To open the full report:
- Open Google Analytics 4 and go to the
Reportsmenu on the left. - Navigate to
Life cycle → Engagement → Overview. - Find the User Loyalty card — this is the chart with the three stickiness lines.
- Set the period you need in the top right (for example, the last 30 days) to see the trend.
For deeper retention analysis, use the separate Retention report in the same Life cycle section — it shows returns of new and active users day by day.
How to increase loyalty and stickiness
Stickiness is a manageable metric. If the lines are flat or falling, here is where to work:
- Give a reason to come back. Regular scheduled content, content series, an email newsletter announcing new articles.
- Work on retention, not just acquisition. Push notifications, remarketing and loyalty programs bring back a familiar audience cheaper than acquiring a new one.
- Improve the first experience. Site speed, clear navigation and relevant content raise the chance a user returns.
- Segment by channel. See which traffic sources bring an audience with higher stickiness, and reallocate budget in their favour.
FAQ: the User Loyalty report in Google Analytics 4
What is user loyalty in GA4?
It is a chart report that shows stickiness — how often the audience comes back to the site. It consists of three active-user ratios: DAU/MAU, DAU/WAU and WAU/MAU, expressed as percentages.
What do the DAU/MAU, DAU/WAU and WAU/MAU lines mean?
DAU/MAU is the share of the monthly audience visiting daily (daily stickiness). DAU/WAU is the share of the weekly audience active daily. WAU/MAU is the share of the monthly audience returning within a week — the key loyalty indicator.
What is stickiness in plain words?
Stickiness is an audience return metric. The higher the percentage, the more often people come back to the site. The classic formula is DAU/MAU × 100%. High stickiness means users are used to the product.
What DAU/MAU value is considered good?
It depends on the business type: for a blog and media 2–5% is normal, for e-commerce 5–10%, for SaaS 15–25%, for social networks and games 20–50%+. The benchmark is set by how many reasons there are to visit daily.
Why do the chart lines drop at the very end?
This is almost always an artefact of incomplete data for the last 1–2 days: today’s and often yesterday’s stats are not fully collected, so the ratios are artificially low. The last points of the chart should be ignored.
Why is the green DAU/WAU line so jagged?
This is normal. Daily activity fluctuates with weekdays and weekends: B2B traffic usually drops on weekends and rises on workdays. The green line’s swings by day of week are a natural cycle, not an error.
Where is the loyalty report in Google Analytics 4?
Reports → Life cycle → Engagement → Overview. The User Loyalty card is in the engagement overview. For detailed return analysis there is a separate Retention report in the same section.
Are user loyalty and retention the same thing?
They are related but different. Loyalty (stickiness) shows the frequency of returns via the DAU/WAU/MAU ratios. Retention shows what percentage of a specific cohort returns N days after the first visit.
Read also

How to Grant Access to a Prom.ua Account in 2026
To grant access to your Prom.ua account, open “Settings” → “Managers”, click “Add a manager”, choose a role…

How to Grant Access to a Wix Site in 2026
To grant access to a Wix site, open the “Sites” dashboard, click “…” on the card of the…

How to Grant Access to a Weblium Site in 2026
To grant access to a Weblium site, open the “My websites” section, click “…” on the site card…