Instructions
Microsoft Clarity Review: Heatmaps and Session Recordings — Complete Guide

Microsoft Clarity is Microsoft’s free behavioral analytics tool. It records user sessions, builds click and scroll heatmaps, and automatically detects rage clicks and dead clicks. Complements Google Analytics: GA4 shows ‘what’ happens, Clarity shows ‘why.’ No traffic limits. Free forever.
What Is Microsoft Clarity
Microsoft Clarity is a free behavioral analytics tool from Microsoft. Unlike Google Analytics, which tracks quantitative metrics (sessions, conversions, bounce rate), Clarity lets you see your website through your visitors’ eyes.
Key Clarity features:
- Session recordings — video replays of real user actions (clicks, scrolling, mouse movement)
- Heatmaps — visual maps of clicks, scroll depth, attention zones, and conversions
- AI Insights via Copilot — automatic analysis and session summaries
- Rage clicks & Dead clicks — automatic detection of frustration signals
- GA4 integration — view session recordings directly within GA4
- No limits — free, unlimited traffic, forever
Clarity launched in 2020 and is now used on over 3 million websites worldwide.
Microsoft Clarity vs Google Analytics: Key Differences
The most common question: why use Clarity if I already have Google Analytics? Short answer: they solve different problems and are best used together.
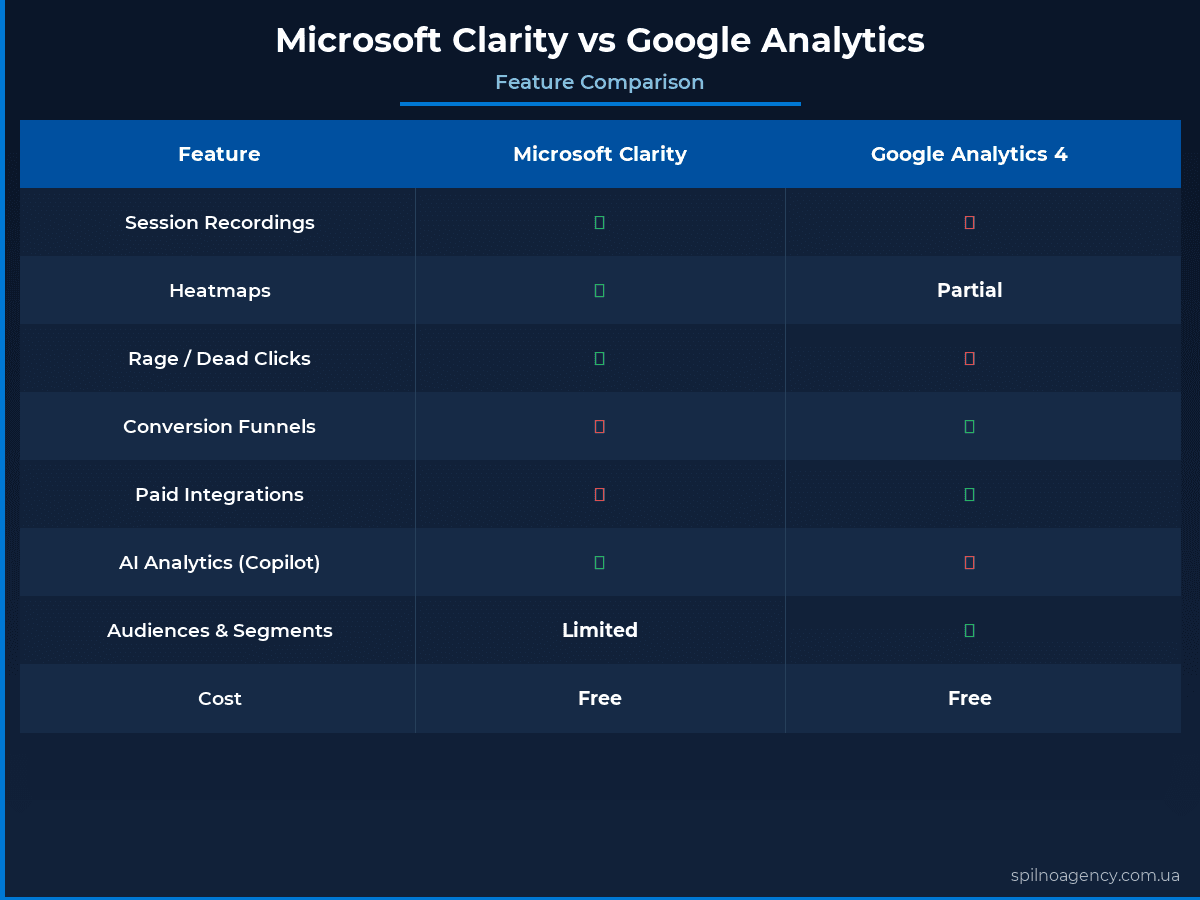
| Feature | Microsoft Clarity | Google Analytics 4 |
|---|---|---|
| Data type | Qualitative analytics (behavior) | Quantitative analytics (numbers) |
| Session recordings | ✅ Full video recordings | ❌ Not available |
| Heatmaps | ✅ 5 heatmap types | ❌ Not available |
| Price | ✅ Free forever | ✅ Free (360 = paid) |
| Traffic limits | ✅ Unlimited | ✅ Up to 10M events/month |
| Conversions & funnels | ⚠️ Basic funnel tracking | ✅ Full e-commerce reporting |
| E-commerce reports | ⚠️ Limited | ✅ Full (GA4 + BigQuery) |
| AI analysis | ✅ Copilot built-in | ✅ Gemini insights |
| Integration between them | ✅ Clarity connects to GA4 | ✅ GA4 opens Clarity |
| GDPR / Privacy | ✅ Auto field masking | ✅ Consent Mode v2 |
Bottom line: GA4 answers ‘how many’, ‘from where’, ‘when’. Clarity answers ‘why’ and ‘how’. The optimal strategy is using both tools simultaneously.
Session Recordings: How They Work
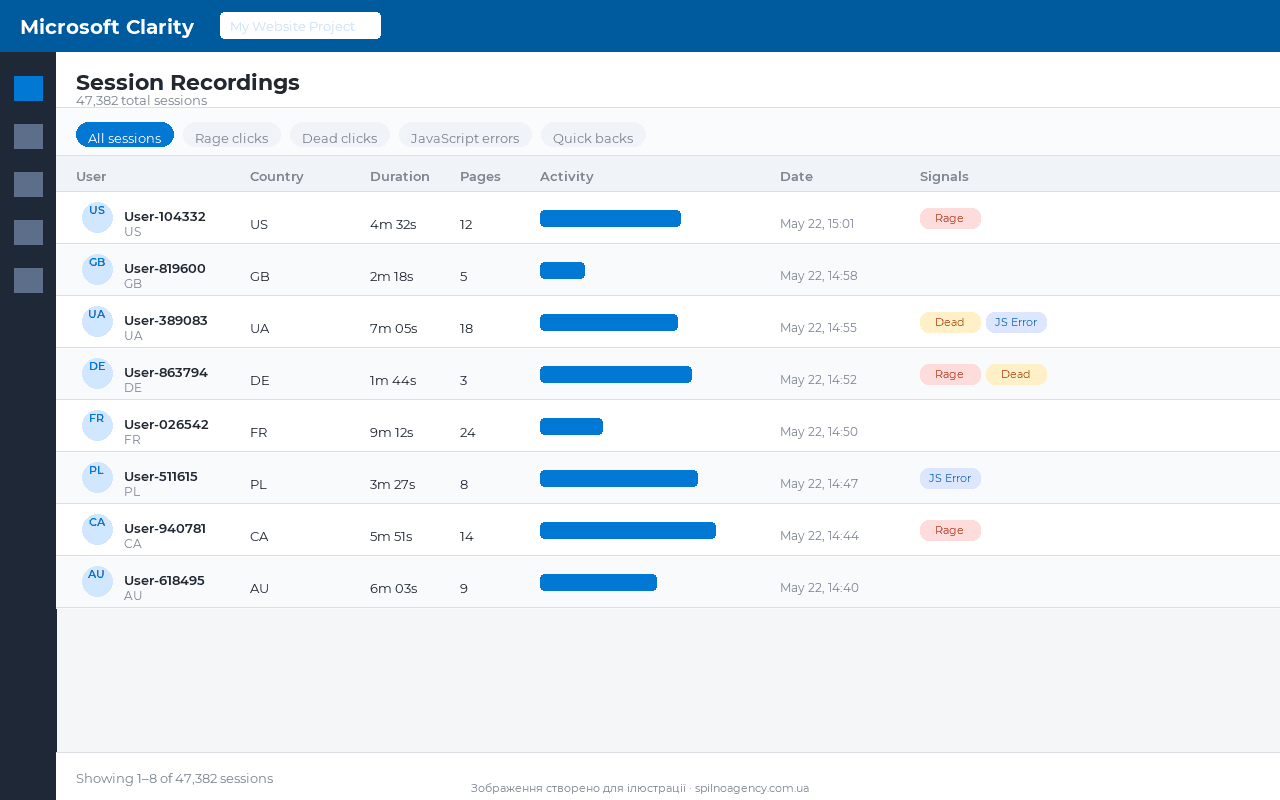
A session recording is a visual replay of a real user’s actions on your website. You see the cursor, clicks, scrolling, text input (anonymized), and page navigation — like watching a video of the user’s session.
What Session Recordings Capture
- Mouse movements — where users look and hover
- Clicks — which elements are clicked (including rage clicks and dead clicks)
- Scrolling — how far down the page users scroll
- Text input — only the fact of typing, never passwords or payment data
- Navigation — page transitions within a session
- Device and browser — desktop, mobile, tablet, OS, resolution
Rage Clicks and Dead Clicks
Clarity automatically detects two types of problematic behavior:
- Rage Click — user clicks the same element 3+ times rapidly (sign of frustration or broken interaction)
- Dead Click — click on a non-interactive element (user expected it to be a link or button)
- Excessive Scrolling — repeated scrolling up and down (user is searching and can’t find what they need)
- Quick Back — user visited a page and quickly returned (possible content dissatisfaction)
Heatmaps: 5 Types and How to Read Them
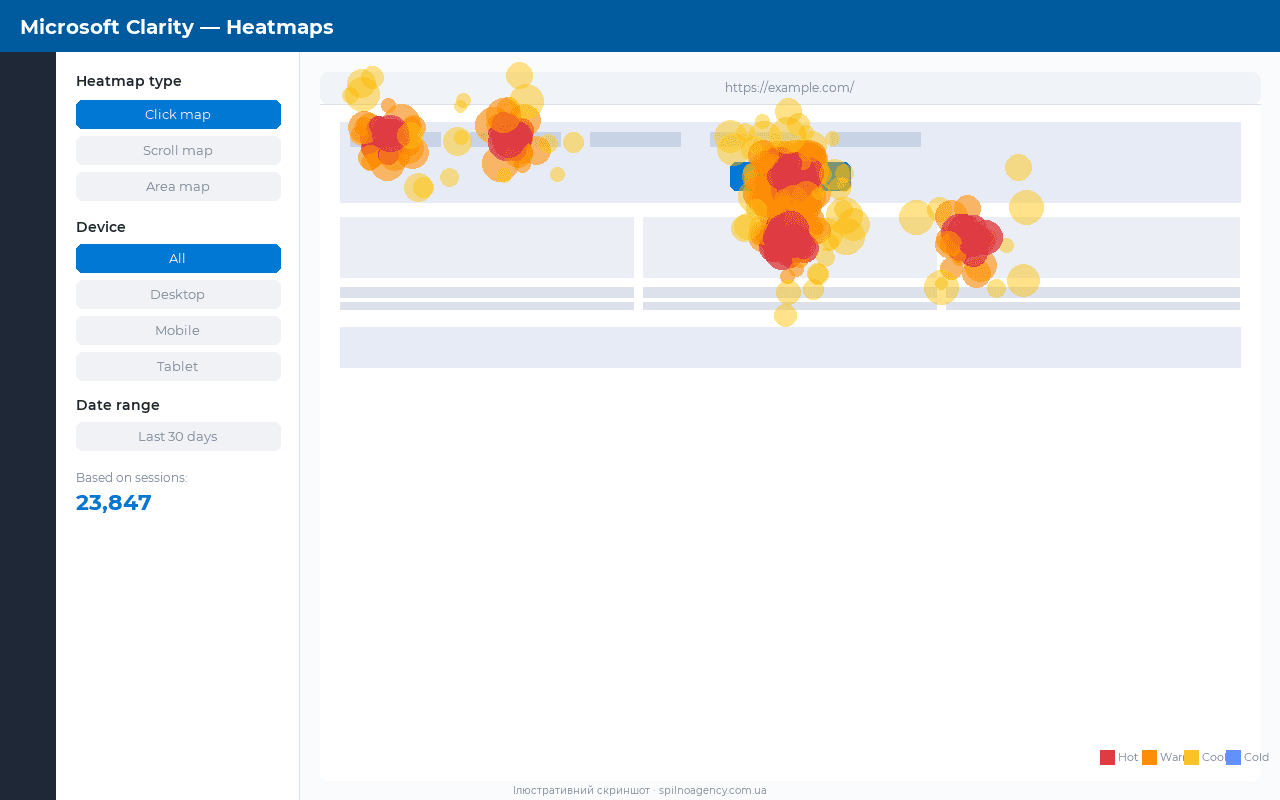
A heatmap is an aggregated visualization of thousands of users’ actions on a single page. Unlike session recordings (individual visitor), a heatmap shows the overall picture across all visitors for a selected period.
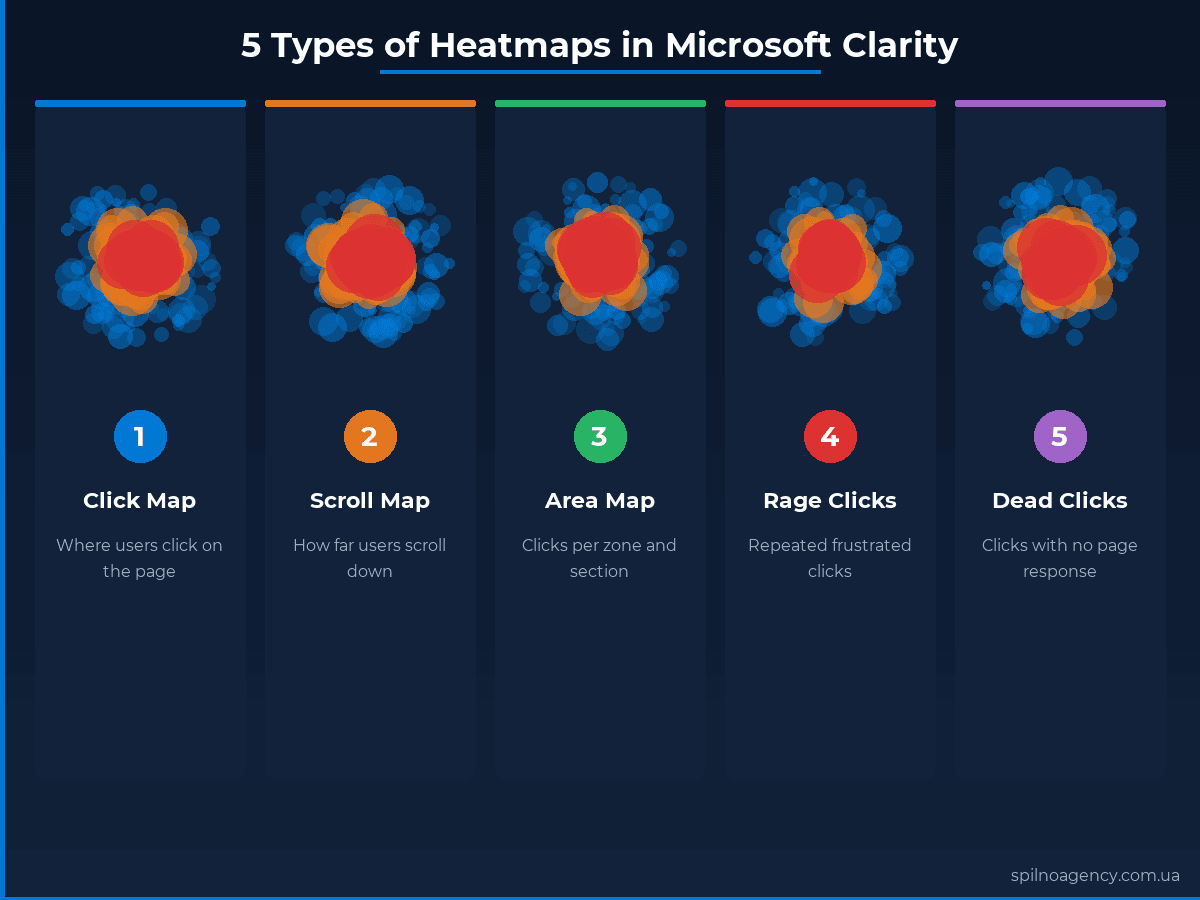
| Type | What It Shows | Practical Use |
|---|---|---|
| Click Map | Where users actually click (hotspots) | Check CTA button engagement, find dead clicks |
| Scroll Map | How far users scroll (% of visitors reaching each point) | Decide where to place main CTAs, find drop-off points |
| Area Map | Engagement with specific page sections or zones | Evaluate content block or banner performance |
| Attention Map | Where users spend the most time | Optimize placement of key messages and offers |
| Conversion Map | Behavior of converters vs non-converters | Compare how successful visitors interact vs those who bounce |
How to Read Heatmaps Correctly
- Red/orange = high activity (many clicks/attention)
- Yellow/green = medium activity
- Blue = low activity
- Always filter by device (desktop vs mobile — behavior is very different)
- Use Compare Screenshots for A/B version comparisons
- A heatmap doesn’t replace A/B tests but helps form hypotheses for them
How to Install Microsoft Clarity
Installation takes 5-10 minutes and requires no programming skills.
- Go to clarity.microsoft.com and sign up (via Microsoft or Google account)
- Click Add new project, enter your site name and URL
- Copy the tracking script from Settings → Setup
- Add the script to your site’s
<head>section - Verify via the Clarity Chrome Extension or wait a few hours for first data
Installing on WordPress
- Install the official Microsoft Clarity plugin from WP Admin → Plugins
- Activate the plugin and enter your Project ID
- Save — done, no manual code required
Microsoft Clarity + GA4 Integration
One of Clarity’s most valuable features is its two-way integration with GA4:
- GA4 → Clarity: Click ‘View recordings’ in a GA4 report to immediately open Clarity recordings for that audience segment
- Clarity → GA4: Session recordings show UTM parameters and traffic sources from GA4
- Shared segments: Filter recordings by GA4 goals (converted / not converted users)
To connect: Clarity → Settings → Integrations → Google Analytics → Connect. Requires access to the relevant GA4 account.
Privacy and GDPR Compliance
Microsoft Clarity automatically protects sensitive data:
- Passwords are never recorded
- Credit card numbers are masked automatically
- Email addresses in forms are masked by default
- Visitor IP addresses are anonymized
- You can specify additional HTML classes or attributes for custom masking
Since October 2025, Clarity requires a valid Consent Mode signal for visitors from EEA, UK, and Switzerland. Without consent, Clarity won’t collect data from these users.
Clarity Insights Dashboard and AI Copilot
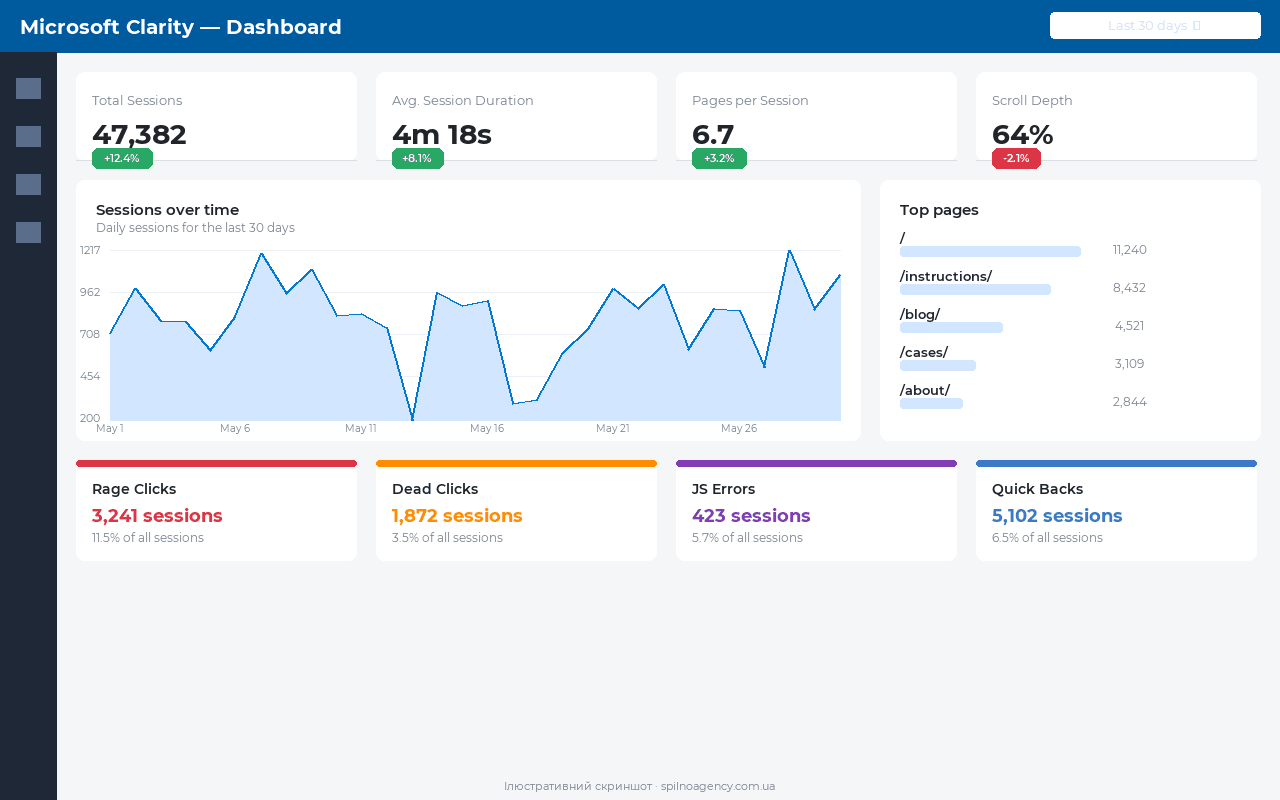
Beyond recordings and heatmaps, Clarity provides automatic AI insights:
- Copilot in Clarity — ask questions in natural language: ‘Why did conversions drop this week?’, ‘Where are users most confused?’
- Smart Events — clicks, scrolls, and text input tracked automatically without code setup
- Funnel Tracking — multi-step funnels (registration, checkout)
- Segments — filter any data by device, country, UTM, behavior
- Website Benchmarks (Beta) — compare your metrics to industry averages
Microsoft Clarity vs Hotjar
| Feature | Microsoft Clarity | Hotjar |
|---|---|---|
| Price | ✅ Free forever | ⚠️ Free (limited) / from $32/month |
| Session recordings | ✅ Unlimited | ⚠️ Up to 35/day (free) |
| Heatmaps | ✅ 5 types, unlimited | ⚠️ Limited on free plan |
| Surveys & Polls | ❌ Not available | ✅ Built-in surveys |
| Rage/Dead clicks | ✅ Automatic detection | ✅ Available |
| AI analysis | ✅ Copilot built-in | ⚠️ Additional cost |
| GA4 integration | ✅ Official | ⚠️ Via GTM |
| GDPR Consent Mode | ✅ Built-in | ⚠️ Requires setup |
Spilno Agency recommendation: On a limited budget — Clarity wins without question (free + unlimited). If you need surveys and feedback forms — Hotjar complements Clarity well.
Frequently Asked Questions
What is Microsoft Clarity?
Microsoft Clarity is a free behavioral analytics tool by Microsoft. It records user sessions (video replays of visitor interactions) and builds heatmaps of clicks, scrolling, and attention. It works on any website with no traffic limits.
How is Microsoft Clarity different from Google Analytics?
Google Analytics tells you WHAT happens (session counts, conversions, traffic sources). Microsoft Clarity shows WHY — you watch video recordings of how users interact with your pages, where they click, how far they scroll. They complement each other and should be used together.
Is Microsoft Clarity free?
Microsoft Clarity is completely free — and will remain free forever. There are no limits on sessions, traffic, or pages. Even enterprise-level usage is available at no cost.
Is Microsoft Clarity GDPR-compliant?
Yes. Clarity automatically masks password fields and payment data. By default, sensitive fields (email, card numbers) are not recorded. You can configure additional masking in the project settings. You need to update your Privacy Policy and Cookie Banner accordingly. Since October 2025, Clarity requires Consent Mode for visitors from EEA, UK, and Switzerland.
How long are session recordings stored?
Session recordings are stored for 90 days. Heatmaps are built based on data from any selected period within available recordings.
How do I install Microsoft Clarity?
Register at clarity.microsoft.com, create a project, copy the tracking script, and add it to your site’s
section. For WordPress, use the official Microsoft Clarity plugin. First data appears within a few hours.
Read also
CMS Comparison for Corporate Website: WordPress, Joomla, Drupal, Wix, Shopify — SEO 2026
Choosing a CMS is one of the most critical decisions when building a corporate website. WordPress, Joomla, Drupal,…
GA4 Measurement Protocol: What It Is and How to Set It Up
GA4 Measurement Protocol is Google’s HTTP API that lets you send analytics events directly from a server, offline…
Ecommerce Google Analytics 4 Verification Checklist. A Spilno Agency Template
A step-by-step checklist to verify GA4 ecommerce events before launching Google Ads and Meta Ads. Free Google Sheets…