ROAS, ROMI, ROI and other key digital marketing metrics: 2026 guide

If you’ve ever sat through a marketing zoom call and heard “our ROAS is 4 but ROMI is negative and CAC is three times LTV” — this guide is for you. Digital marketing acronyms multiply faster than ad placements, and every abbreviation hides a concrete formula, a business logic and a management decision. The exact same creative with a ROAS of 5 can be golden for e-commerce and lethal for SaaS — context decides everything.
In this article we systematically break down 30+ key digital marketing metrics: what they mean, how they are calculated, where teams get them wrong most often, and — most importantly — how each one ties to a stage of the marketing funnel and to the tools a marketer can actually use to move the needle. Treat this as a reference: keep it in a tab and come back whenever a new acronym pops up in a dashboard.
Table of contents
- Financial basics: Revenue, Profit, Margin
- Impression & click metrics: CPM, CPC, CTR
- Action & conversion metrics: CR, CPL, CPA
- Spend efficiency metrics: ROI, ROMI, ROAS
- Customer value metrics: LTV, CAC, LTV/CAC, Payback
- Cohort & product metrics: AOV, Frequency, Retention, Churn
- Funnel × KPI — which metric matters at each stage
- Tools a digital marketer uses to move each KPI
- 2025–2026 benchmarks by industry
- 7 common mistakes when working with metrics
- FAQ
1. Financial basics: Revenue, Profit, Margin
Before talking about ROAS or ROMI, we need to agree on the basics — otherwise every calculation falls apart. Most of the “weird” numbers in reports start exactly here: the marketer counts one thing, finance another, and the owner is looking at a third.
Revenue
Revenue is the total money received from selling products or services over a period, before deducting any costs. In e-commerce it’s GMV from your dashboard; in SaaS — MRR × 12 or ARR. It’s the biggest “pretty” number in the report — every coefficient downstream gets applied to it.
Formula: Revenue = Number of orders × Average Order Value (AOV).
Gross Profit and Margin
Gross profit = Revenue − Cost of Goods Sold (COGS). It’s the money left after paying suppliers but before marketing, rent and salaries.
Gross Margin = (Revenue − COGS) ÷ Revenue × 100%. Same metric as a percentage. In physical goods margins are typically 20–35%, in services 60–85%, in SaaS 75–90%. Remember this number: ROAS and ROMI can’t be properly calculated without it.
Net Profit
Net profit = Revenue − All costs (COGS + marketing + operations + taxes). This is what actually stays in the bank. Marketing efficiency metrics (ROI, ROMI) work on profit, not revenue — which is why a marketer must know the company’s margin.
2. Impression & click metrics: CPM, CPC, CTR
These three metrics live at the very top of the funnel — the user hasn’t bought anything yet but has already seen your ad. They don’t tell you about profitability, but they show how efficiently you’re buying attention.
CPM — Cost Per Mille (cost per 1000 impressions)
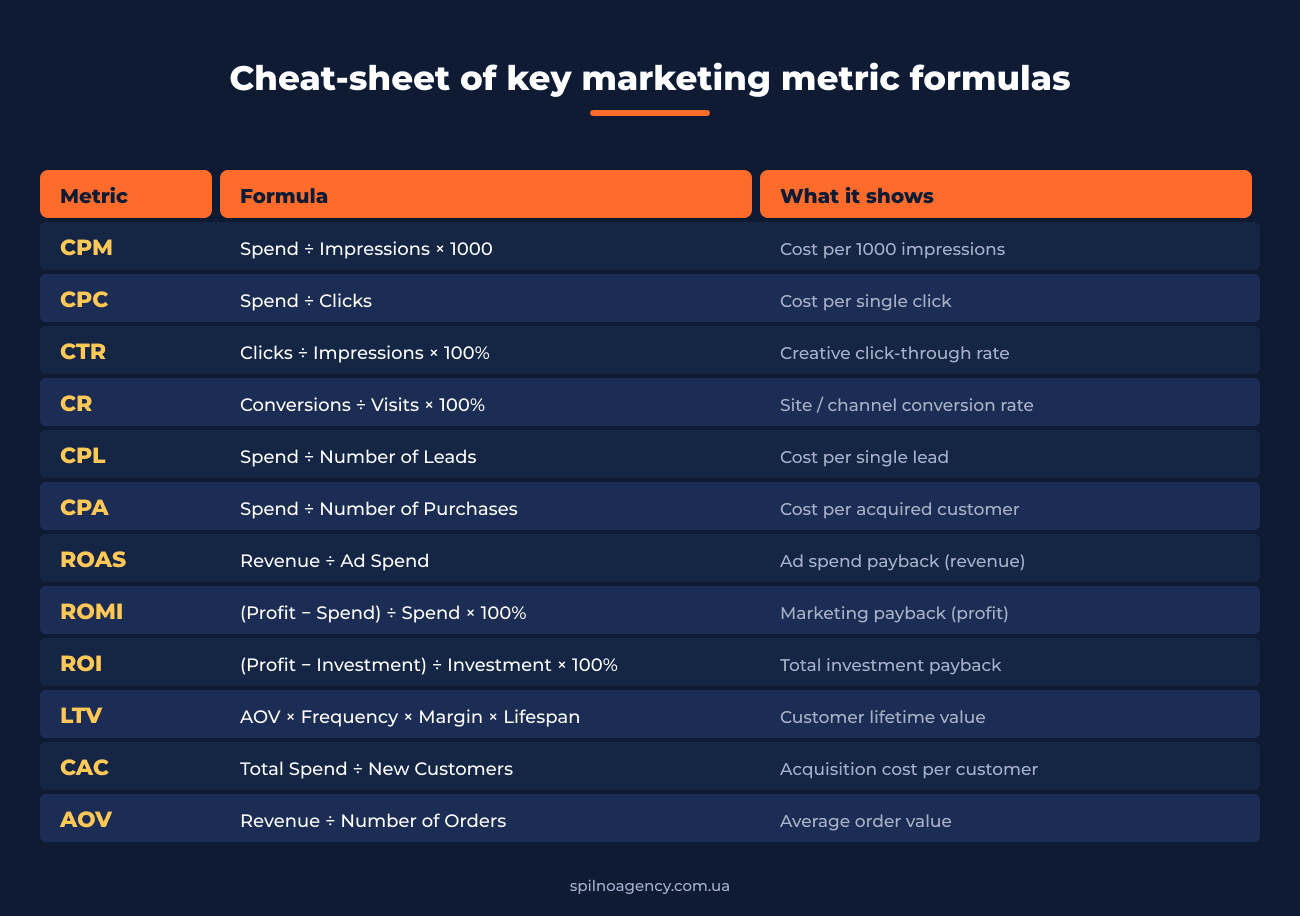
CPM = (Ad spend ÷ Impressions) × 1000. Shows how much it costs to reach 1000 pairs of eyes. CPM is the base currency for display, video and reach campaigns on Meta, TikTok, YouTube and DV360.
When it matters: brand awareness campaigns, retargeting warm-up placements, PR. 2025 benchmarks: Meta — $3–10, TikTok — $2–6, YouTube — $5–12, Google Display — $1.5–4.
CPC — Cost Per Click
CPC = Ad spend ÷ Number of clicks. The base currency of performance channels: Google Ads Search, Bing, shopping marketplaces. In CPC pricing you only pay when someone actually clicks through to your site.
CPC is driven by: ad quality (Quality Score in Google), keyword relevance, competitor bids, daypart, geo. In commercial niches Google Search CPC ranges from $0.20 (informational) to $50+ (legal, real estate, healthcare in the US).
CTR — Click-Through Rate
CTR = (Clicks ÷ Impressions) × 100%. Shows the share of people who saw your ad and clicked on it. CTR is the fastest indicator of whether the creative is “working”.
2025 benchmarks: Google Search — 5–9% (brand queries up to 25%), Google Display — 0.4–0.8%, Meta Feed — 1–2%, TikTok In-Feed — 1.5–3%, Email — 2–4%, organic search — 28% at position 1 down to 1–2% at position 10.
Watch out: high CTR without follow-through conversion often means clickbait creative that drives irrelevant traffic. CTR has to be read together with CR and CPA, otherwise you’re paying for “click tourists”.
3. Action & conversion metrics: CR, CPL, CPA
CR — Conversion Rate
CR = (Target actions ÷ Visits) × 100%. A “target action” is whatever you decide: purchase, lead form, call, add-to-cart, sign-up, PDF download. So when someone says “our CR is 8%”, the first question is — conversion into what?
Typical e-commerce CRs 2025: 1.5–3% (mass market), 0.5–1.5% (premium), 3–6% (native ads + retargeting). In B2B SaaS landing→trial converts at 5–15%, trial→paid at 12–25%.
CPL — Cost Per Lead
CPL = Ad spend ÷ Number of leads. A lead is a user who submitted contact info but hasn’t paid yet. CPL is the headline KPI for B2B, real estate, education, healthcare and finance.
Always tag lead quality: a “cheap” lead that doesn’t qualify can produce a CPA 5× higher than an “expensive” one.
CPA — Cost Per Acquisition
CPA = Ad spend ÷ Number of paying customers. CPA is the actual cost of an acquired buyer from a specific channel. Often confused with CAC: CPA is calculated per channel, CAC is calculated company-wide including every cost.
CPA must stay below the gross margin on the AOV — otherwise the channel runs at a loss. In e-commerce a healthy ratio is: CPA ≤ 30–40% of AOV × Margin.
4. Spend efficiency metrics: ROI, ROMI, ROAS — the big three
Here we are. ROI, ROMI and ROAS are the three metrics most commonly confused in reports, RFPs and even job ads. The difference between them isn’t cosmetic — it flips management decisions by 180 degrees.
ROAS — Return On Ad Spend
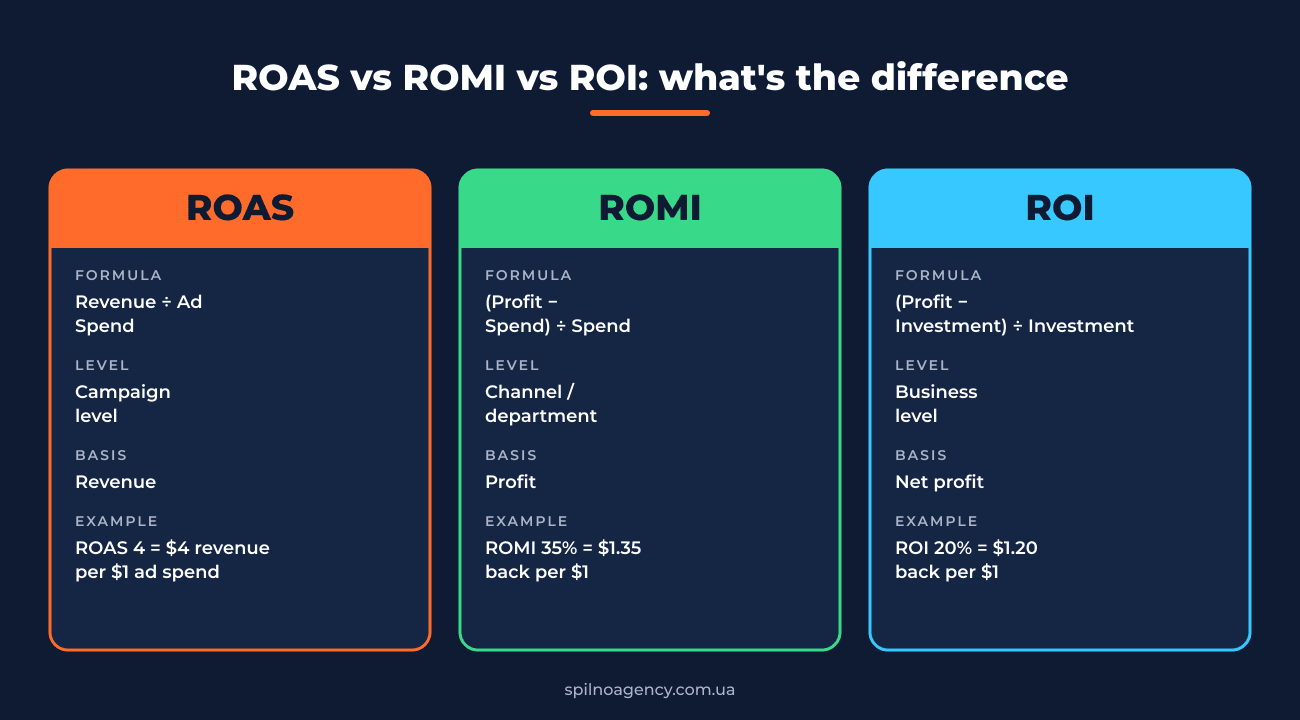
ROAS = Revenue from ads ÷ Ad spend. Expressed as a multiplier (4×) or percentage (400%). It’s the fastest metric available in every ad platform (Google Ads, Meta, TikTok). It answers: “How many dollars of revenue did each dollar of ad spend generate?”
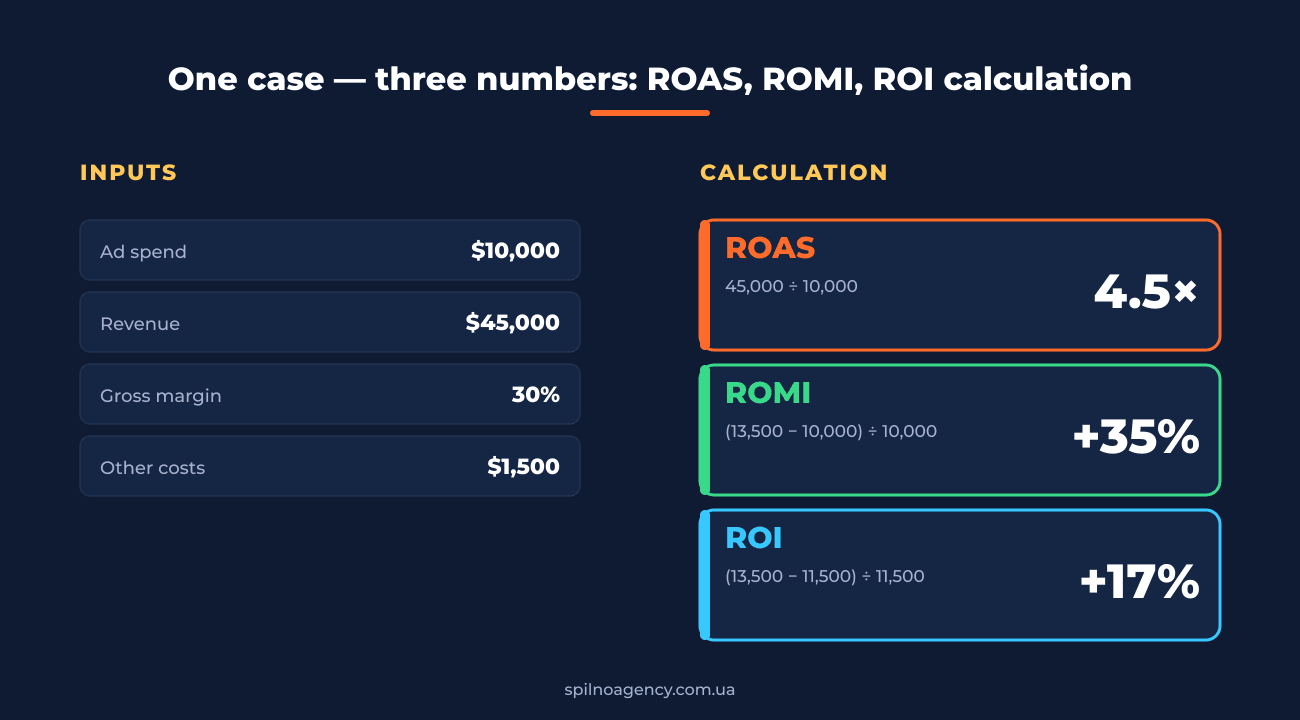
Example: spent $10,000 on Google Shopping, generated $45,000 in revenue → ROAS = 4.5 (or 450%).
Pitfall: ROAS deals with revenue, not profit. A ROAS of 4 on a store with a 20% margin means $100 of ads brought $400 in revenue, of which the gross profit is $80. If channel cost + fulfillment costs more than $80 you’re losing money. This is why there’s a break-even ROAS = 1 ÷ Margin. At a 25% margin break-even ROAS is 4. Anything below that is burning cash.
ROMI — Return On Marketing Investment
ROMI = (Gross profit from marketing − Marketing spend) ÷ Marketing spend × 100%. ROMI factors in margin and is reported as a percentage. It’s the coefficient that actually shows whether marketing is paying off.
Example: same store, $10,000 in ads, $45,000 revenue, 30% margin. Gross profit = $45,000 × 30% = $13,500. ROMI = (13,500 − 10,000) ÷ 10,000 × 100% = 35%. Every dollar of marketing returns with 35 cents of profit.
ROMI < 0 — marketing is unprofitable. ROMI = 0 — break-even. ROMI > 0 — growth. Healthy ranges in e-commerce: 30–150%; performance agencies aim for 100%+.
ROI — Return On Investment
ROI = (Net profit − Total investment) ÷ Total investment × 100%. ROI is the broadest concept, borrowed from finance. It includes all investments (not just marketing): development, warehouse, salaries, equipment. Pure marketing ROI in a vacuum is hard to compute — that’s exactly why ROMI was invented.
When to use what:
- ROAS — at the ad-platform, campaign or creative level. You’re optimising ads.
- ROMI — at the marketing department, channel or monthly budget level. You’re reporting to management.
- ROI — at the business or project level. You’re justifying investment to the owner.
5. Customer value metrics: LTV, CAC, LTV/CAC, Payback
LTV — Customer Lifetime Value
LTV = AOV × Frequency × Margin × Lifespan. LTV answers “how much money will this customer bring us over the entire relationship”. In SaaS LTV is typically ARPU ÷ Churn. In e-commerce it’s calculated cohort-by-cohort over 12 or 24 months.
CAC — Customer Acquisition Cost
CAC = (Total marketing + sales spend) ÷ New customers in the period. CAC differs from CPA because it includes all spend, not just ads: marketer salaries, sales team, tools, content production.
LTV/CAC — the unit-economics holy grail
The single ratio that summarises unit economics. Healthy ranges:
- LTV/CAC < 1 — you’re paying more to acquire customers than they bring back. Stop the bleeding.
- LTV/CAC = 1–3 — borderline; optimise either the channel or retention.
- LTV/CAC = 3–5 — healthy business.
- LTV/CAC > 5 — there’s room to scale marketing more aggressively.
Payback Period
Payback = CAC ÷ (Average monthly profit per customer). Number of months it takes a customer to “pay back” their acquisition cost. SaaS targets < 12 months; classic e-commerce < 3 months.
6. Cohort & product metrics: AOV, Frequency, Retention, Churn
AOV (Average Order Value) = Revenue ÷ Orders. The cheapest way to lift ROAS isn’t cutting spend — it’s lifting AOV (cross-sell, up-sell, free-shipping threshold).
Purchase Frequency — how many times the average customer buys per year. A solid number in retail is 1.8–2.5; in food delivery 8–15.
Retention Rate = (Active customers at end − New customers) ÷ Active at start × 100%. Shows how many customers stick around. In SaaS the difference between 90% and 95% monthly retention compounds into 2–3× LTV over two years.
Churn Rate — the opposite of retention. Churn = 1 − Retention. B2C SaaS typically sits at 5–7% monthly churn, B2B SaaS at 1–3%.
7. Funnel × KPI — which metric matters at each stage
Any funnel splits into 4 stages: TOFU (Top of Funnel — awareness), MOFU (Middle — consideration), BOFU (Bottom — decision/purchase) and Loyalty (retention). Each stage has its own metric set and its own “healthy range”.
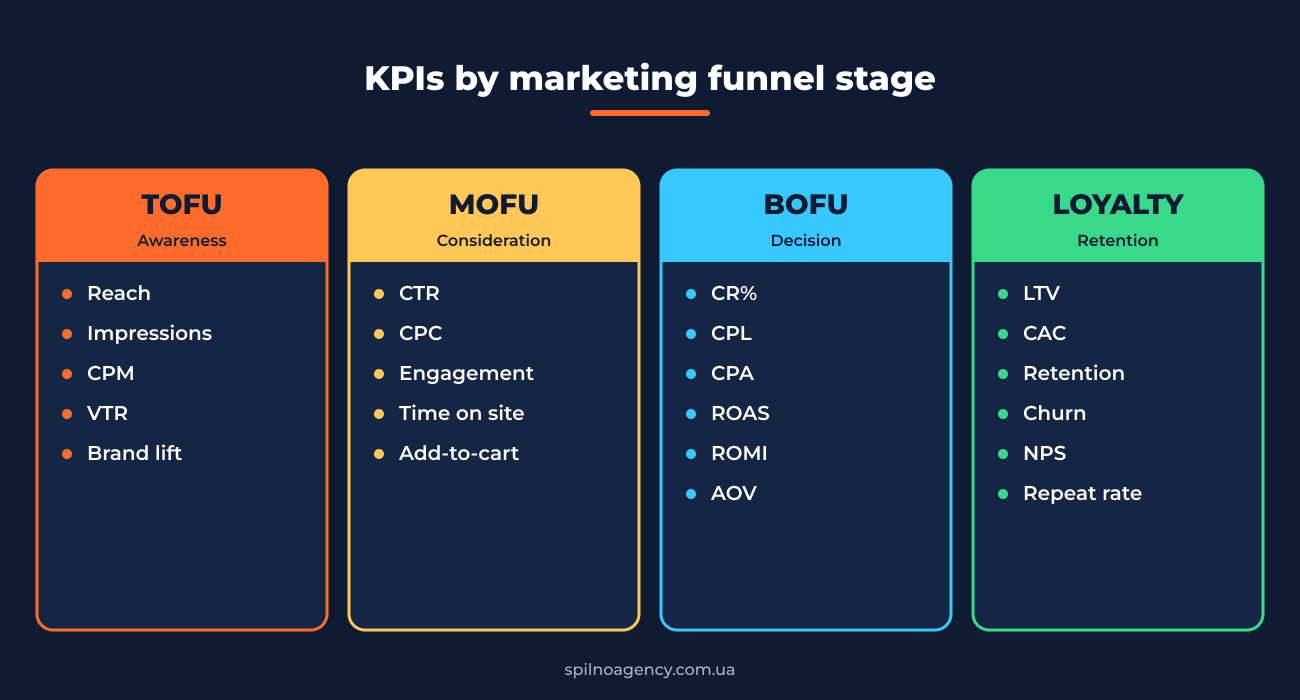
TOFU — awareness
Goal: introduce the brand to a maximum relevant audience. KPI: Reach, Impressions, CPM, Brand Search Lift, VTR, Engagement Rate. Tools: Meta Reach/Awareness, TikTok Top-View, YouTube CPM/CPV, Google Display, PR, influencers, SEO informational content.
MOFU — consideration
Goal: move users from “I’ve heard of the brand” to “I’m seriously considering buying”. KPI: CTR, Time on Site, Pages per Session, Lead Quality, Cost per Engaged Session, Bounce Rate. Tools: SEO commercial queries, content marketing (comparisons, guides), email nurturing, retargeting, Google Discovery, lookalike audiences.
BOFU — decision
Goal: close the sale. KPI: CPL, CPA, CR, ROAS, ROMI, Cart Abandonment Rate, Checkout CR. Tools: Google Search (commercial intent), Performance Max, Meta Conversion, marketplaces, cart-abandonment retargeting, trigger emails, SMS, chatbots.
Loyalty — retention
Goal: bring the customer back to buy again. KPI: Retention, Churn, Repeat Purchase Rate, LTV, NPS, Frequency. Tools: Email marketing (Klaviyo, Mailchimp), push notifications, loyalty programs, CRM segmentation, referrals, retargeting to existing customers.
8. Tools a digital marketer uses to move each KPI
Every KPI has multiple levers. Below is a map of typical tools grouped by the metric they move fastest.
How to lower CPC
- Improve Google Ads Quality Score: keyword–ad–landing-page relevance.
- Segment campaigns by match type and add negative keywords.
- Use Smart Bidding (Maximize Conversions, Target CPA) — the algorithm normalises bids.
- Refresh Meta creatives — once creative fatigues, CPC climbs.
- Audit daypart and geo — 20% of budget at certain hours often delivers 80% of cheap clicks.
How to lift CTR
- Put the main benefit + a number in the headline (“−30%”, “free shipping over $50”).
- Run 3–5 creatives in parallel and kill anything 30% below the median CTR.
- Add Google Ads extensions (sitelinks, snippets, prices).
- On Meta — short vertical videos 6–15s with a hook in the first 3 seconds.
- Adapt creative to audience: lookalike vs retargeting need different messages.
How to lift CR
- Speed up the site: Core Web Vitals (LCP < 2.5s, INP < 200ms) add 10–20% to CR.
- Simplify the form: every extra field costs 5–10% CR.
- Add social proof: reviews, live order counter, customer logos.
- Keep on-site chat or callback — saves 5–15% of waverers.
- A/B-test CTA: colour, copy, position.
How to lift ROAS / ROMI
- Shift budget from broad campaigns into ones with ROAS above break-even.
- Work cross-sell and up-sell — lift AOV without raising spend.
- Exclude poor placements and geographies.
- Connect a promo-feed into Performance Max and Meta Advantage+.
- Grow retargeting and email rescue — the cheapest revenue you have.
How to lower CAC / lift LTV/CAC
- Invest in SEO and content: organic traffic drops average CAC over a 12+ month horizon.
- Referral program: customers bringing customers at near-zero cost.
- Email + CRM automation: repeat purchases lift LTV without raising CAC.
- Segment channels: kill the ones where CAC > LTV even after optimisation.
- Make retention the product team’s headline metric — it divides CAC.
9. 2025–2026 benchmarks by industry
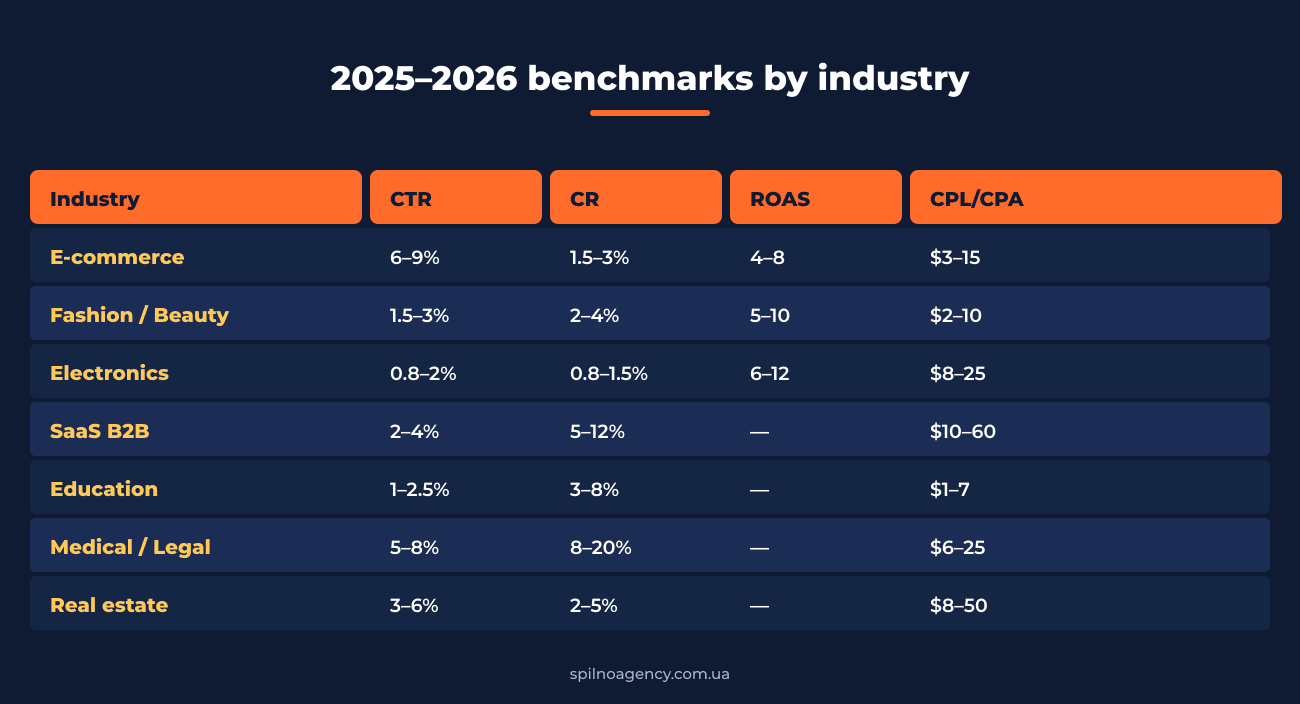
Benchmarks are guideposts, not targets. A niche store can thrive at ROAS 2 with great margins, while another bleeds at ROAS 8 because of expensive logistics. Always cross-check with your own unit economics.
- E-commerce (mass-market): Search CTR 6–9%, Meta CTR 1–2%, CPC $0.3–1.5, CR 1.5–3%, ROAS 4–8, ROMI 30–80%.
- Fashion / Beauty: Meta CTR 1.5–3%, CR 2–4%, ROAS 5–10, AOV $25–80.
- Electronics / premium: CR 0.8–1.5%, ROAS 6–12 (high AOV offsets low CR).
- B2B SaaS: CPL $20–60, landing→trial CR 5–12%, payback 6–18 months.
- Education / info-products: CPL $1–7, webinar→sale CR 3–8%, ROMI 100–300%.
- Medical / legal: CPC $1–5, CPL $6–25, CR 8–20% (narrow hot audience).
- Real estate: CPL $8–50, deal cycle 30–180 days — track LTV/CAC in dollars.
10. 7 common mistakes when working with metrics
- Confusing ROAS and ROMI. ROAS uses revenue, ROMI uses profit. ROAS 4 at 20% margin = ROMI −20%.
- Looking at averages. An average ROAS of 5 can hide a campaign at ROAS 12 and one at ROAS 1.5. Cut by segment.
- Ignoring attribution. Last-click sends all revenue to BOFU channels. Use data-driven attribution in GA4 or marketing-mix modelling.
- Reading CR without guard metrics. High CR on tiny traffic is 2 purchases out of 50 visits — statistically meaningless.
- Not segmenting CAC by channel. A blended CAC hides the fact that one channel is feeding all the others.
- Forgetting margin. A marketer doesn’t need to own the P&L, but without knowing margin they can’t compute ROMI.
- Optimising locally instead of across the funnel. You can crush CPC and lose CR. Optimise final ROMI/LTV, not intermediate steps.
FAQ
How is ROI different from ROMI?
ROI accounts for all investments in the project (development, warehouse, marketing, operations); ROMI only marketing spend. ROMI is the marketing-specific subset of ROI.
What is considered a good ROAS?
Anything above break-even: ROAS > 1 ÷ Margin. At 25% margin “good” ROAS starts at 4; at 50% margin — at 2. There’s no universal “good ROAS” number outside your margin context.
How fast can I tell if a channel pays back?
Compute ROMI over the last 28 days. ROMI > 0 — the channel pays back on margin. If ROMI is stably negative for 2–3 consecutive months, either the channel isn’t yours or it needs a radical creative/landing overhaul.
Can I compare CPL across channels?
Only together with lead quality and downstream lead→customer CR. A Google Search lead at $20 CPL is often worth more than five Meta leads at $4 — because it converts to a sale 5–10× more often.
How often should I recalculate LTV?
Cohort-by-cohort, monthly or quarterly, on 6/12/24-month cohorts. Don’t use “average LTV across the whole base” — it gets skewed by long-tenure customers.
Final thoughts
Metrics don’t decide anything — the decisions you make on top of them do. The classic mistake is trying to “improve ROAS”. That’s easy: turn off the top of the funnel and run only hot retargeting. ROAS goes up, sales go down.
The right discipline is reading metrics in pairs: ROAS + ROMI, CTR + CR, CPL + lead-to-customer CR, CAC + LTV. Always keep a guard metric next to the one you’re optimising, so you don’t fool yourself by improving one number at the expense of another.
If you want to build a structured KPI dashboard for your funnel, set up GA4 + Looker Studio and tie every metric to a business goal — drop us a brief and the Spilno Agency team will help.
Read also
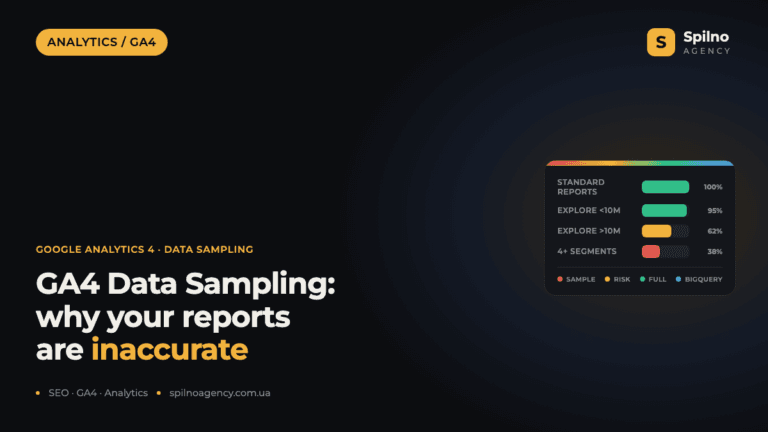
Google Analytics Data Sampling: How to Keep Your GA4 Reports Accurate
Google Analytics data sampling happens when a report is built from a statistical subset of events instead of…
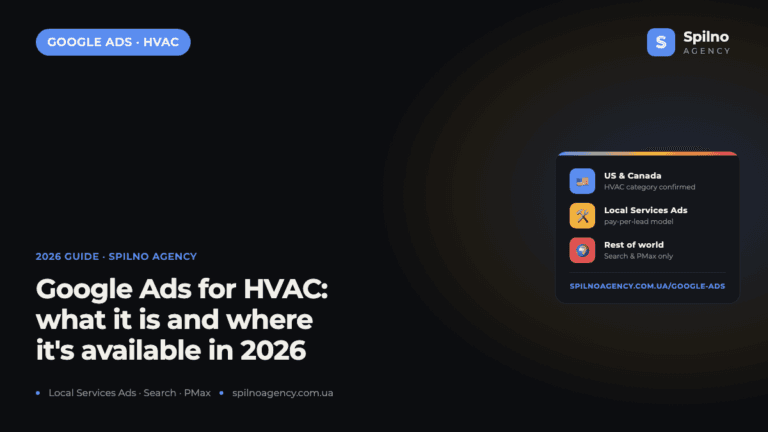
Google Ads for HVAC: What It Is and Where It’s Available in 2026
“Google Ads for HVAC” is the more accurate phrase than the commonly used “HVAC campaigns” — there’s no…
How to Advertise an Intimate-Products Store in Google Merchant Center
Yes, you can advertise intimate products on Google — it’s legal, and Google Merchant Center explicitly allows “adult-oriented…