The GA4 Traffic Acquisition Report: How to Read Channels and Sources

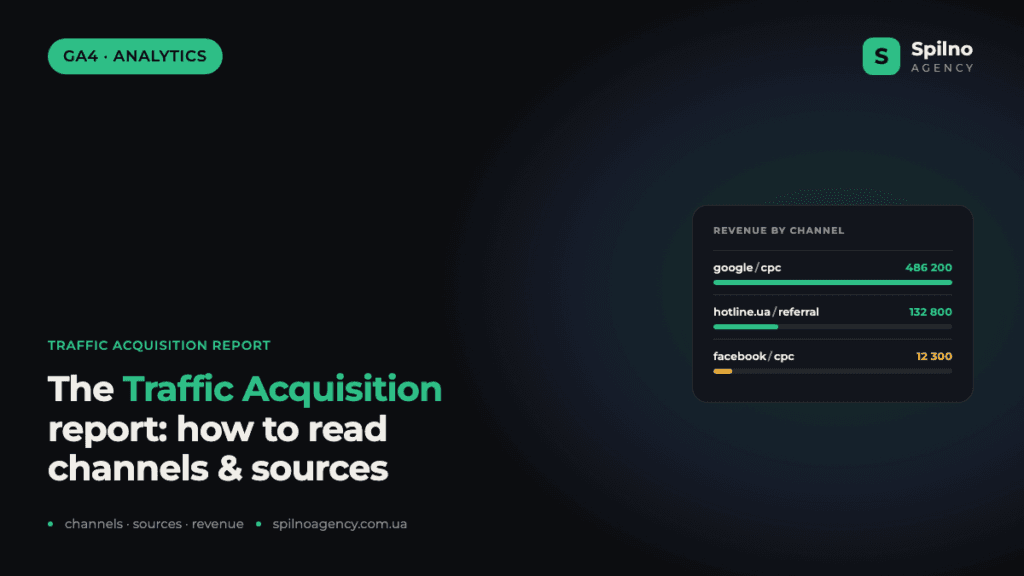
The Traffic Acquisition report in Google Analytics 4 is a table where every row is a channel or traffic source, and the columns show how many sessions it brings, how many of them are engaged, how many key events they trigger and — most importantly for an online store — how much revenue they generate. Read it correctly and you see which channels work, which burn budget and which convert best into sales — and you build your digital channel growth plan on that.
Why Traffic Acquisition is a marketer’s most useful report
Most GA4 reports answer the question “what is happening on the site”. The Traffic Acquisition report answers the question that actually pays a marketer’s salary: where do the people who bring money come from. It joins two things that usually live in separate dashboards — the traffic source and the business result — into one table.
Finding it is simple: in the left GA4 menu → Reports → Acquisition → Traffic acquisition. By default rows are grouped by Default Channel Group, but the real value appears when you switch the dimension to Session source / medium. That is the breakdown we will read below.
Why it matters for the business:
- For an online store — it shows revenue and purchase count per channel. You see that, say,
google/cpcdrives 70% of turnover whilefacebook/cpcbrings traffic but no sales. - For service and lead-gen businesses — instead of revenue the metric is “key events”: leads, calls and form submissions per channel.
- For the owner — it is a map of where the ad money goes and what it returns. One screen instead of ten ad dashboards.
Anatomy of the report: the metrics to read
The left column is the source and medium (source / medium): where and how the user arrived. google/organic is free search, google/cpc is advertising, (direct)/(none) is direct visits. If those labels confuse you, we decoded every popular source in a separate guide — a full source / medium breakdown in GA4. To the right come the metrics, each with its own meaning.
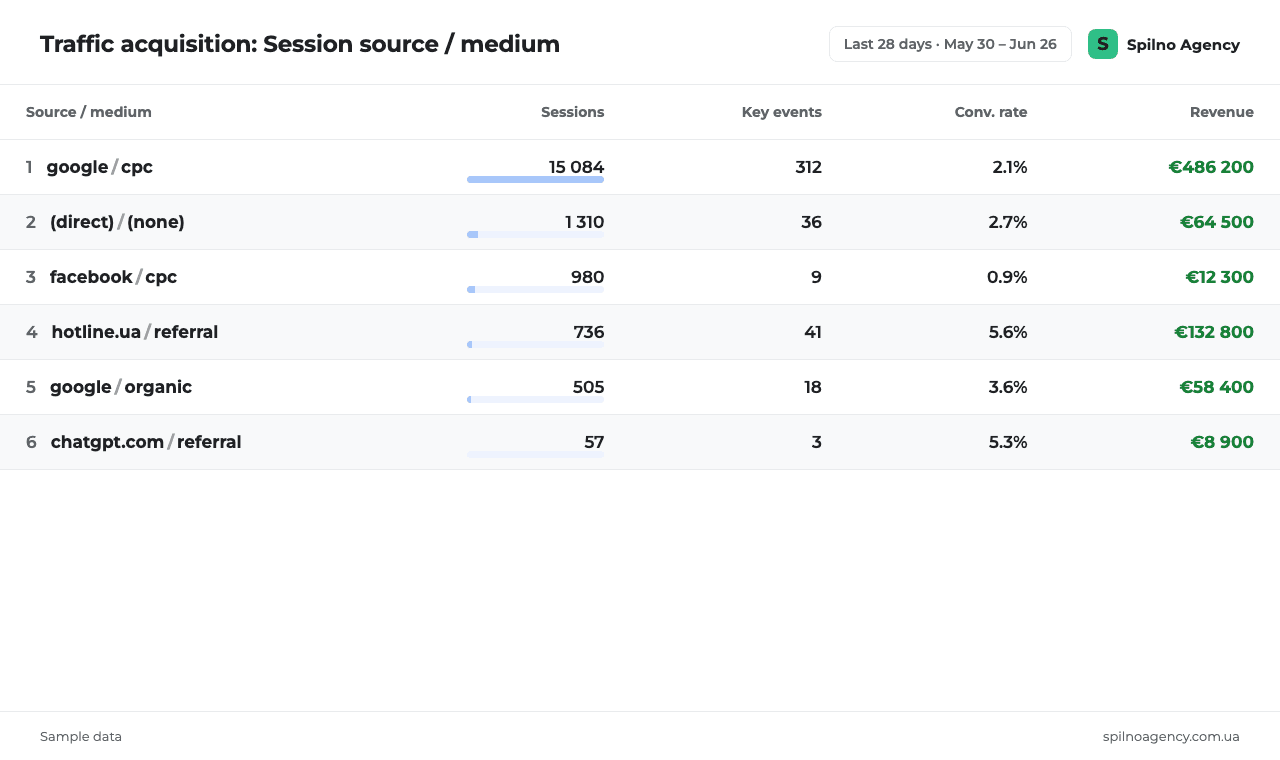
- Sessions — how many times users came from this channel. Raw volume, but it says nothing about quality on its own.
- Engaged sessions — sessions longer than 10 seconds, or with a key event, or with 2+ page views. A filter for “live” traffic versus accidental visits.
- Engagement rate and average engagement time — how interested the people a channel brings are. A low rate at high volume means traffic without meaning.
- Key events — the target actions: purchase, lead, call. This is what you pay for traffic for.
- Key event conversion rate — the share of a channel’s sessions that completed a goal. The main quality metric of a channel.
- Total revenue — the money a channel brought (for e-commerce and goals with assigned value). The final judge.
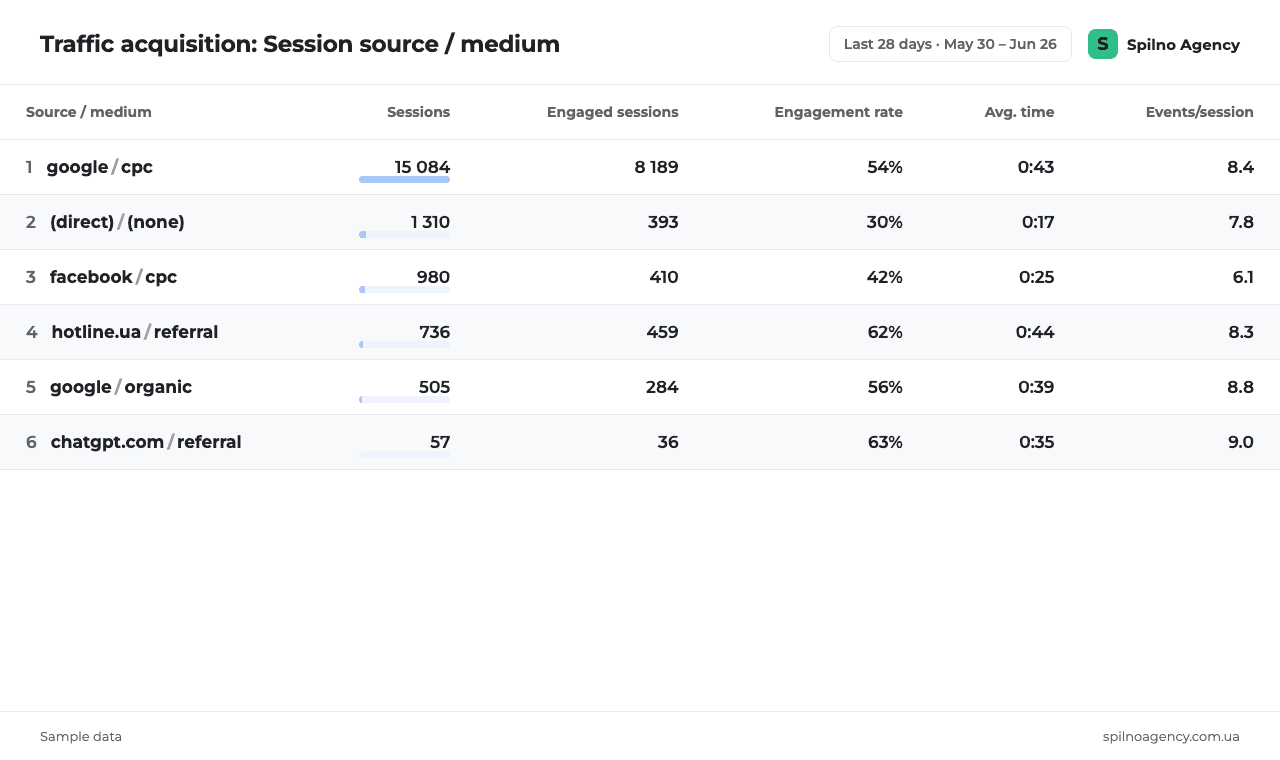
The main reading rule: never look at volume apart from conversion. A channel with 15,000 sessions and 0.5% conversion versus a channel with 700 sessions and 5% conversion — the second one may be more valuable to the business. Always read the trio “volume → conversion → revenue” together.
What this report looks like on a real account
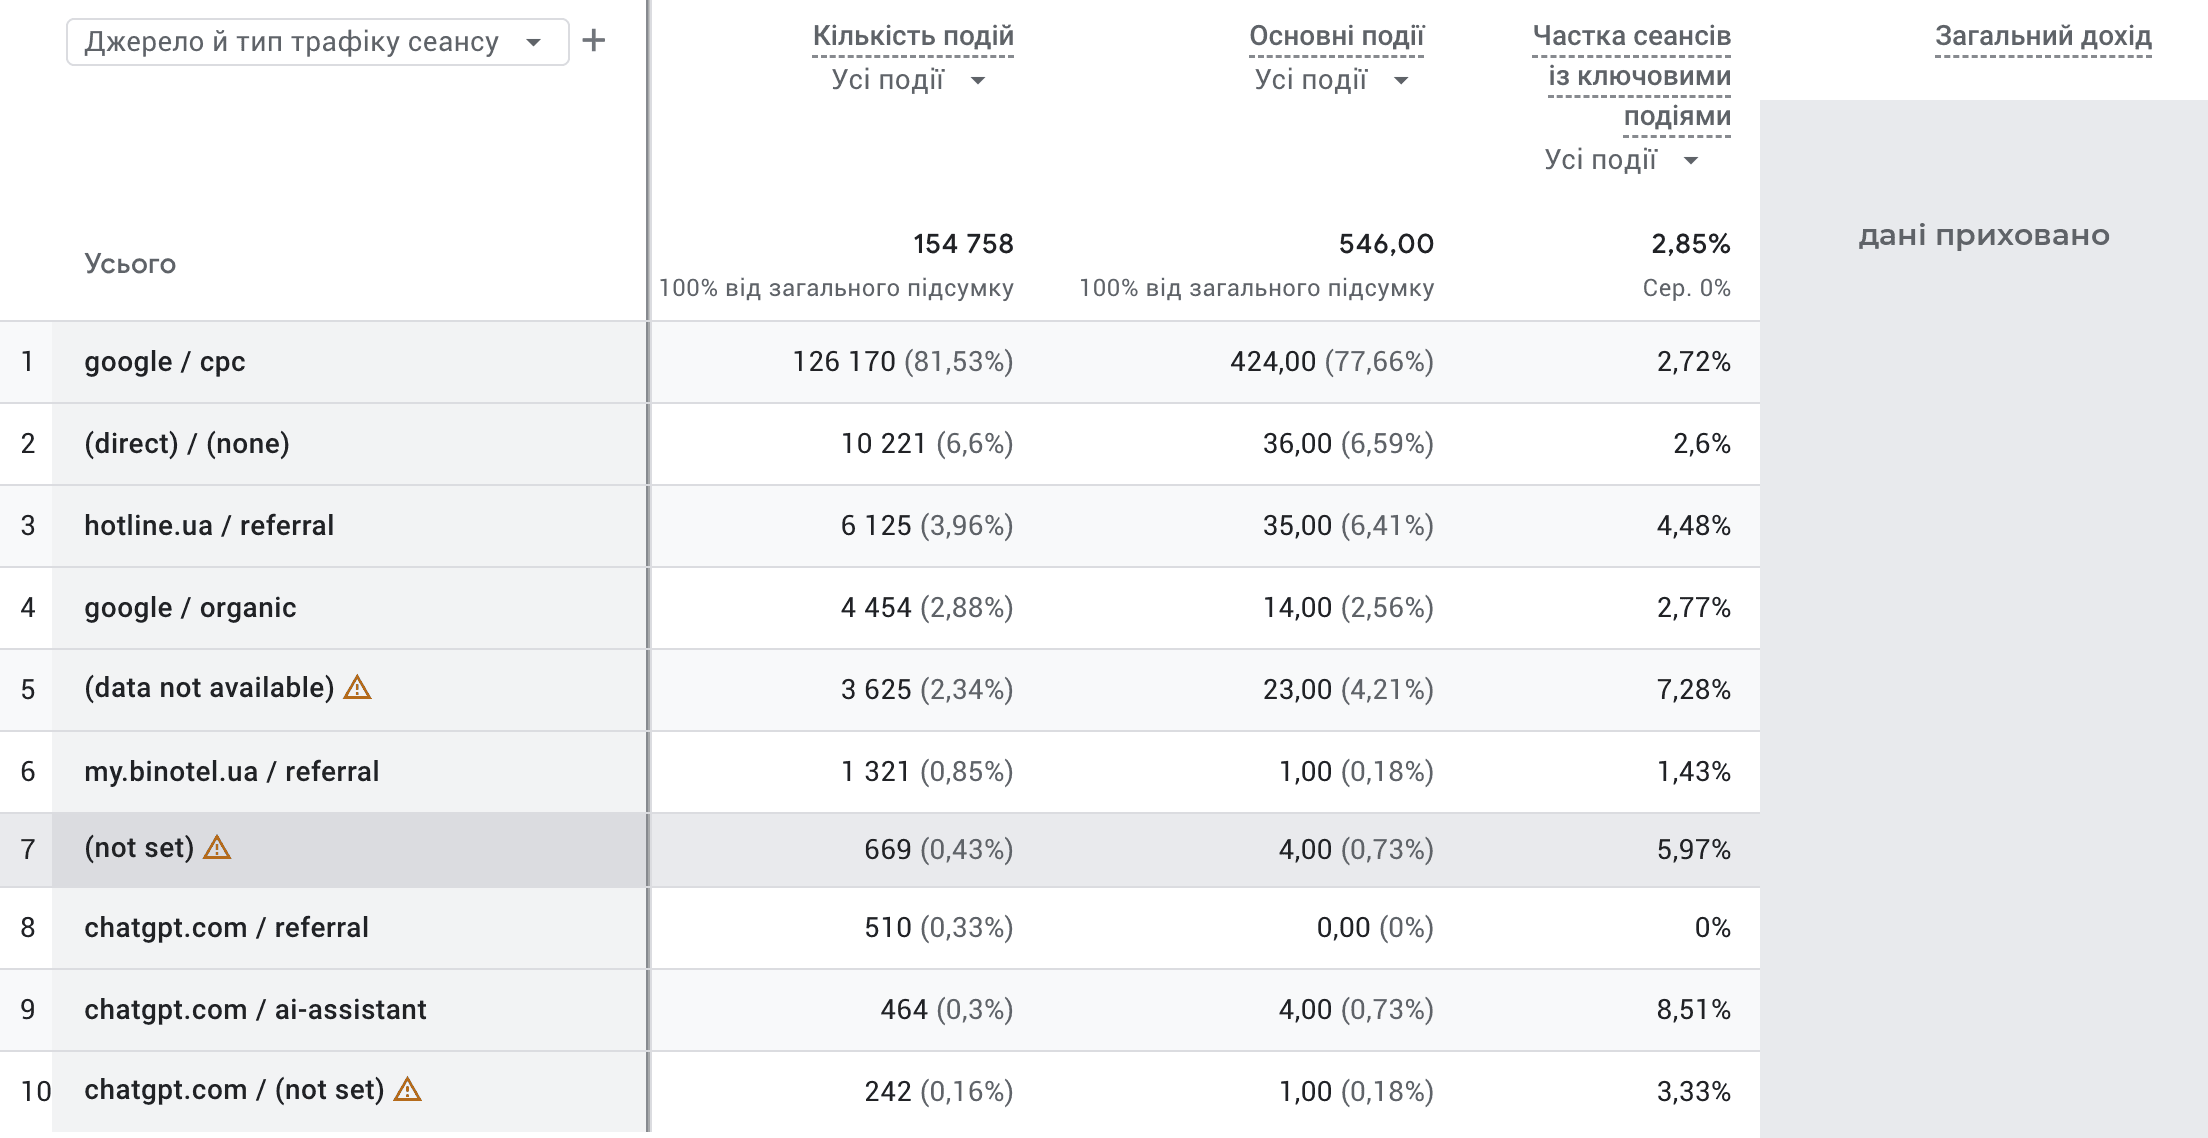
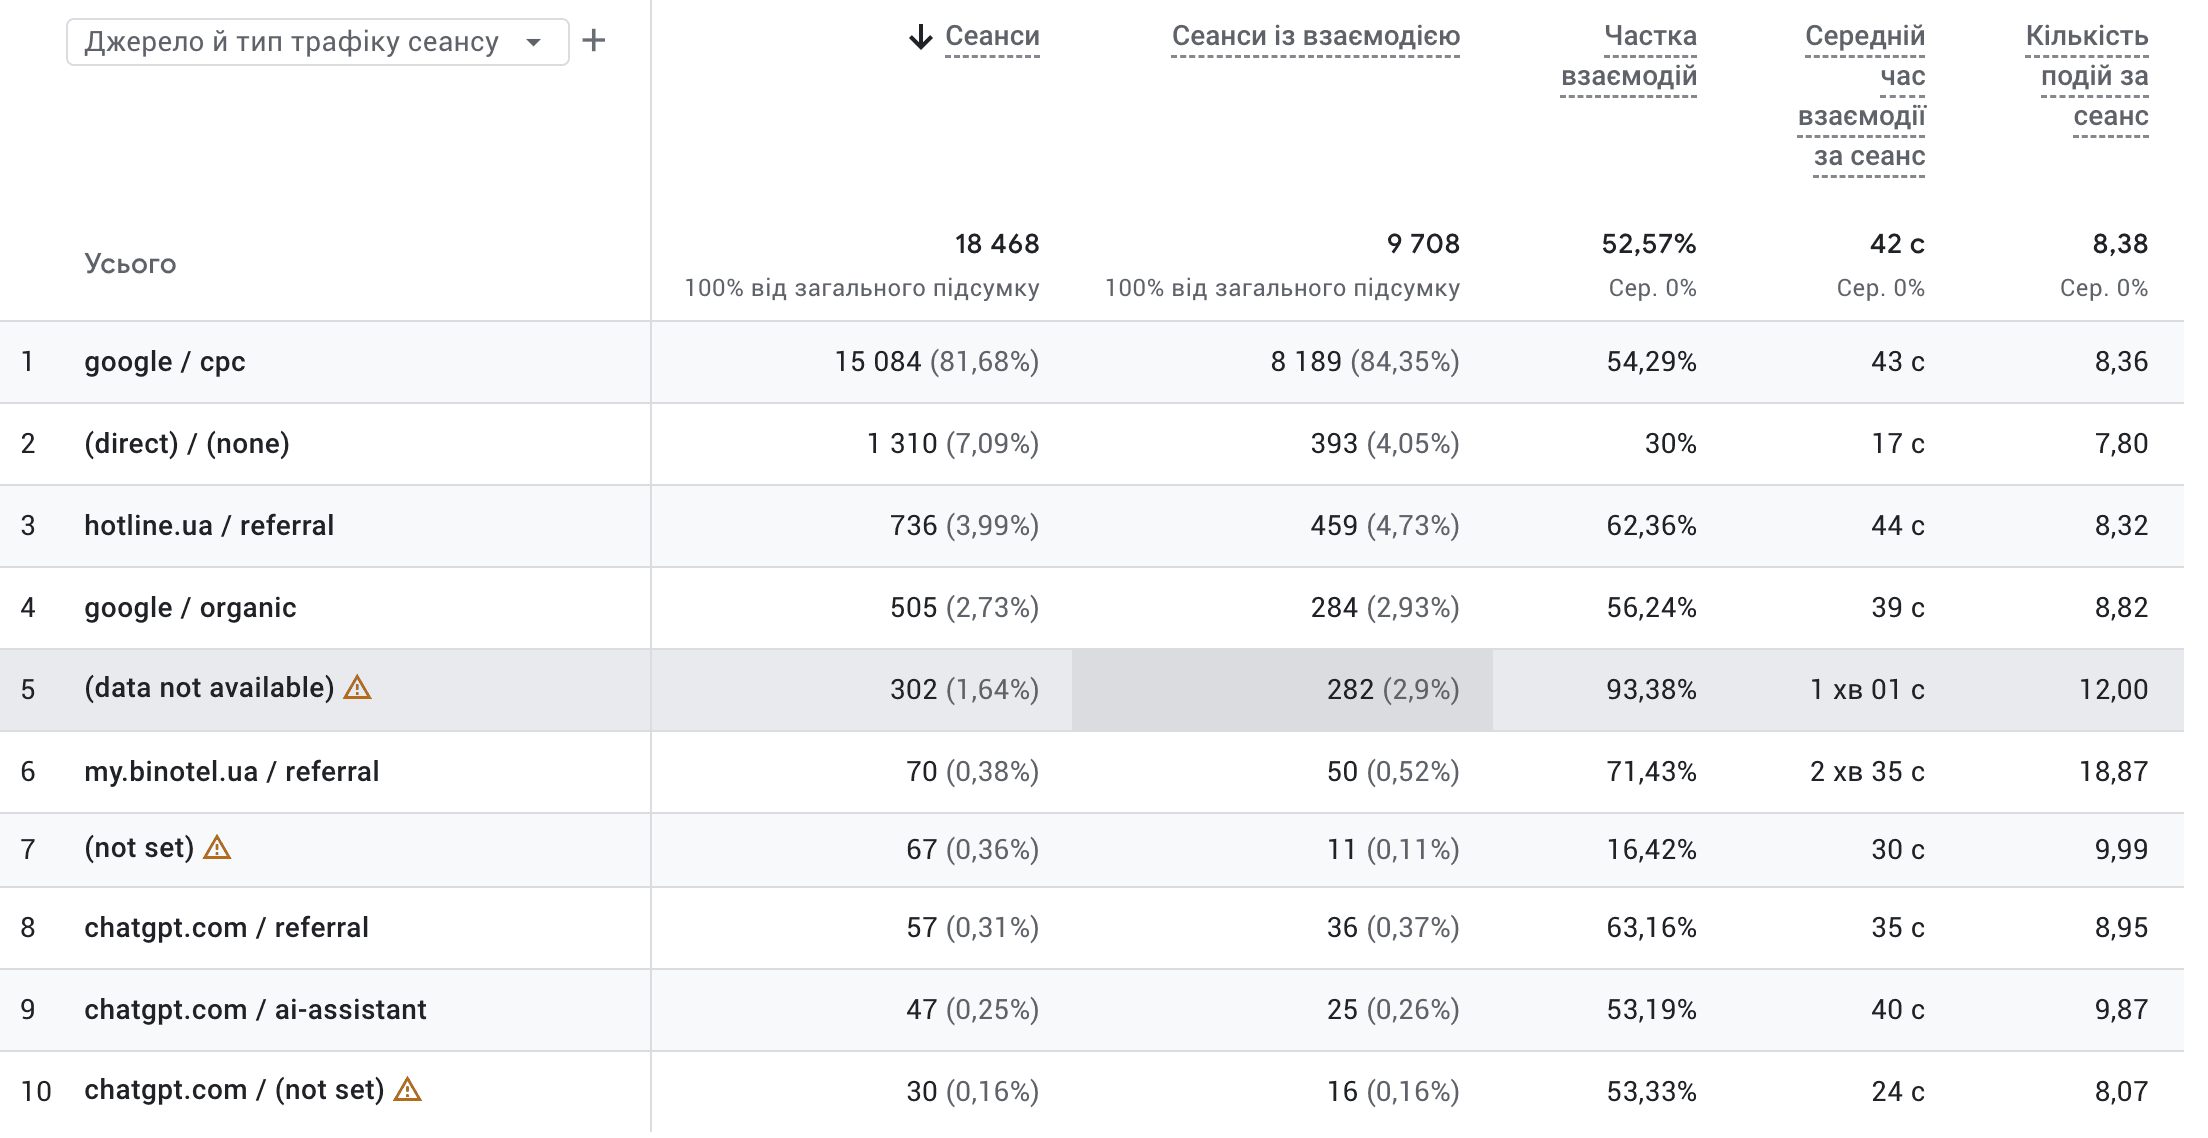
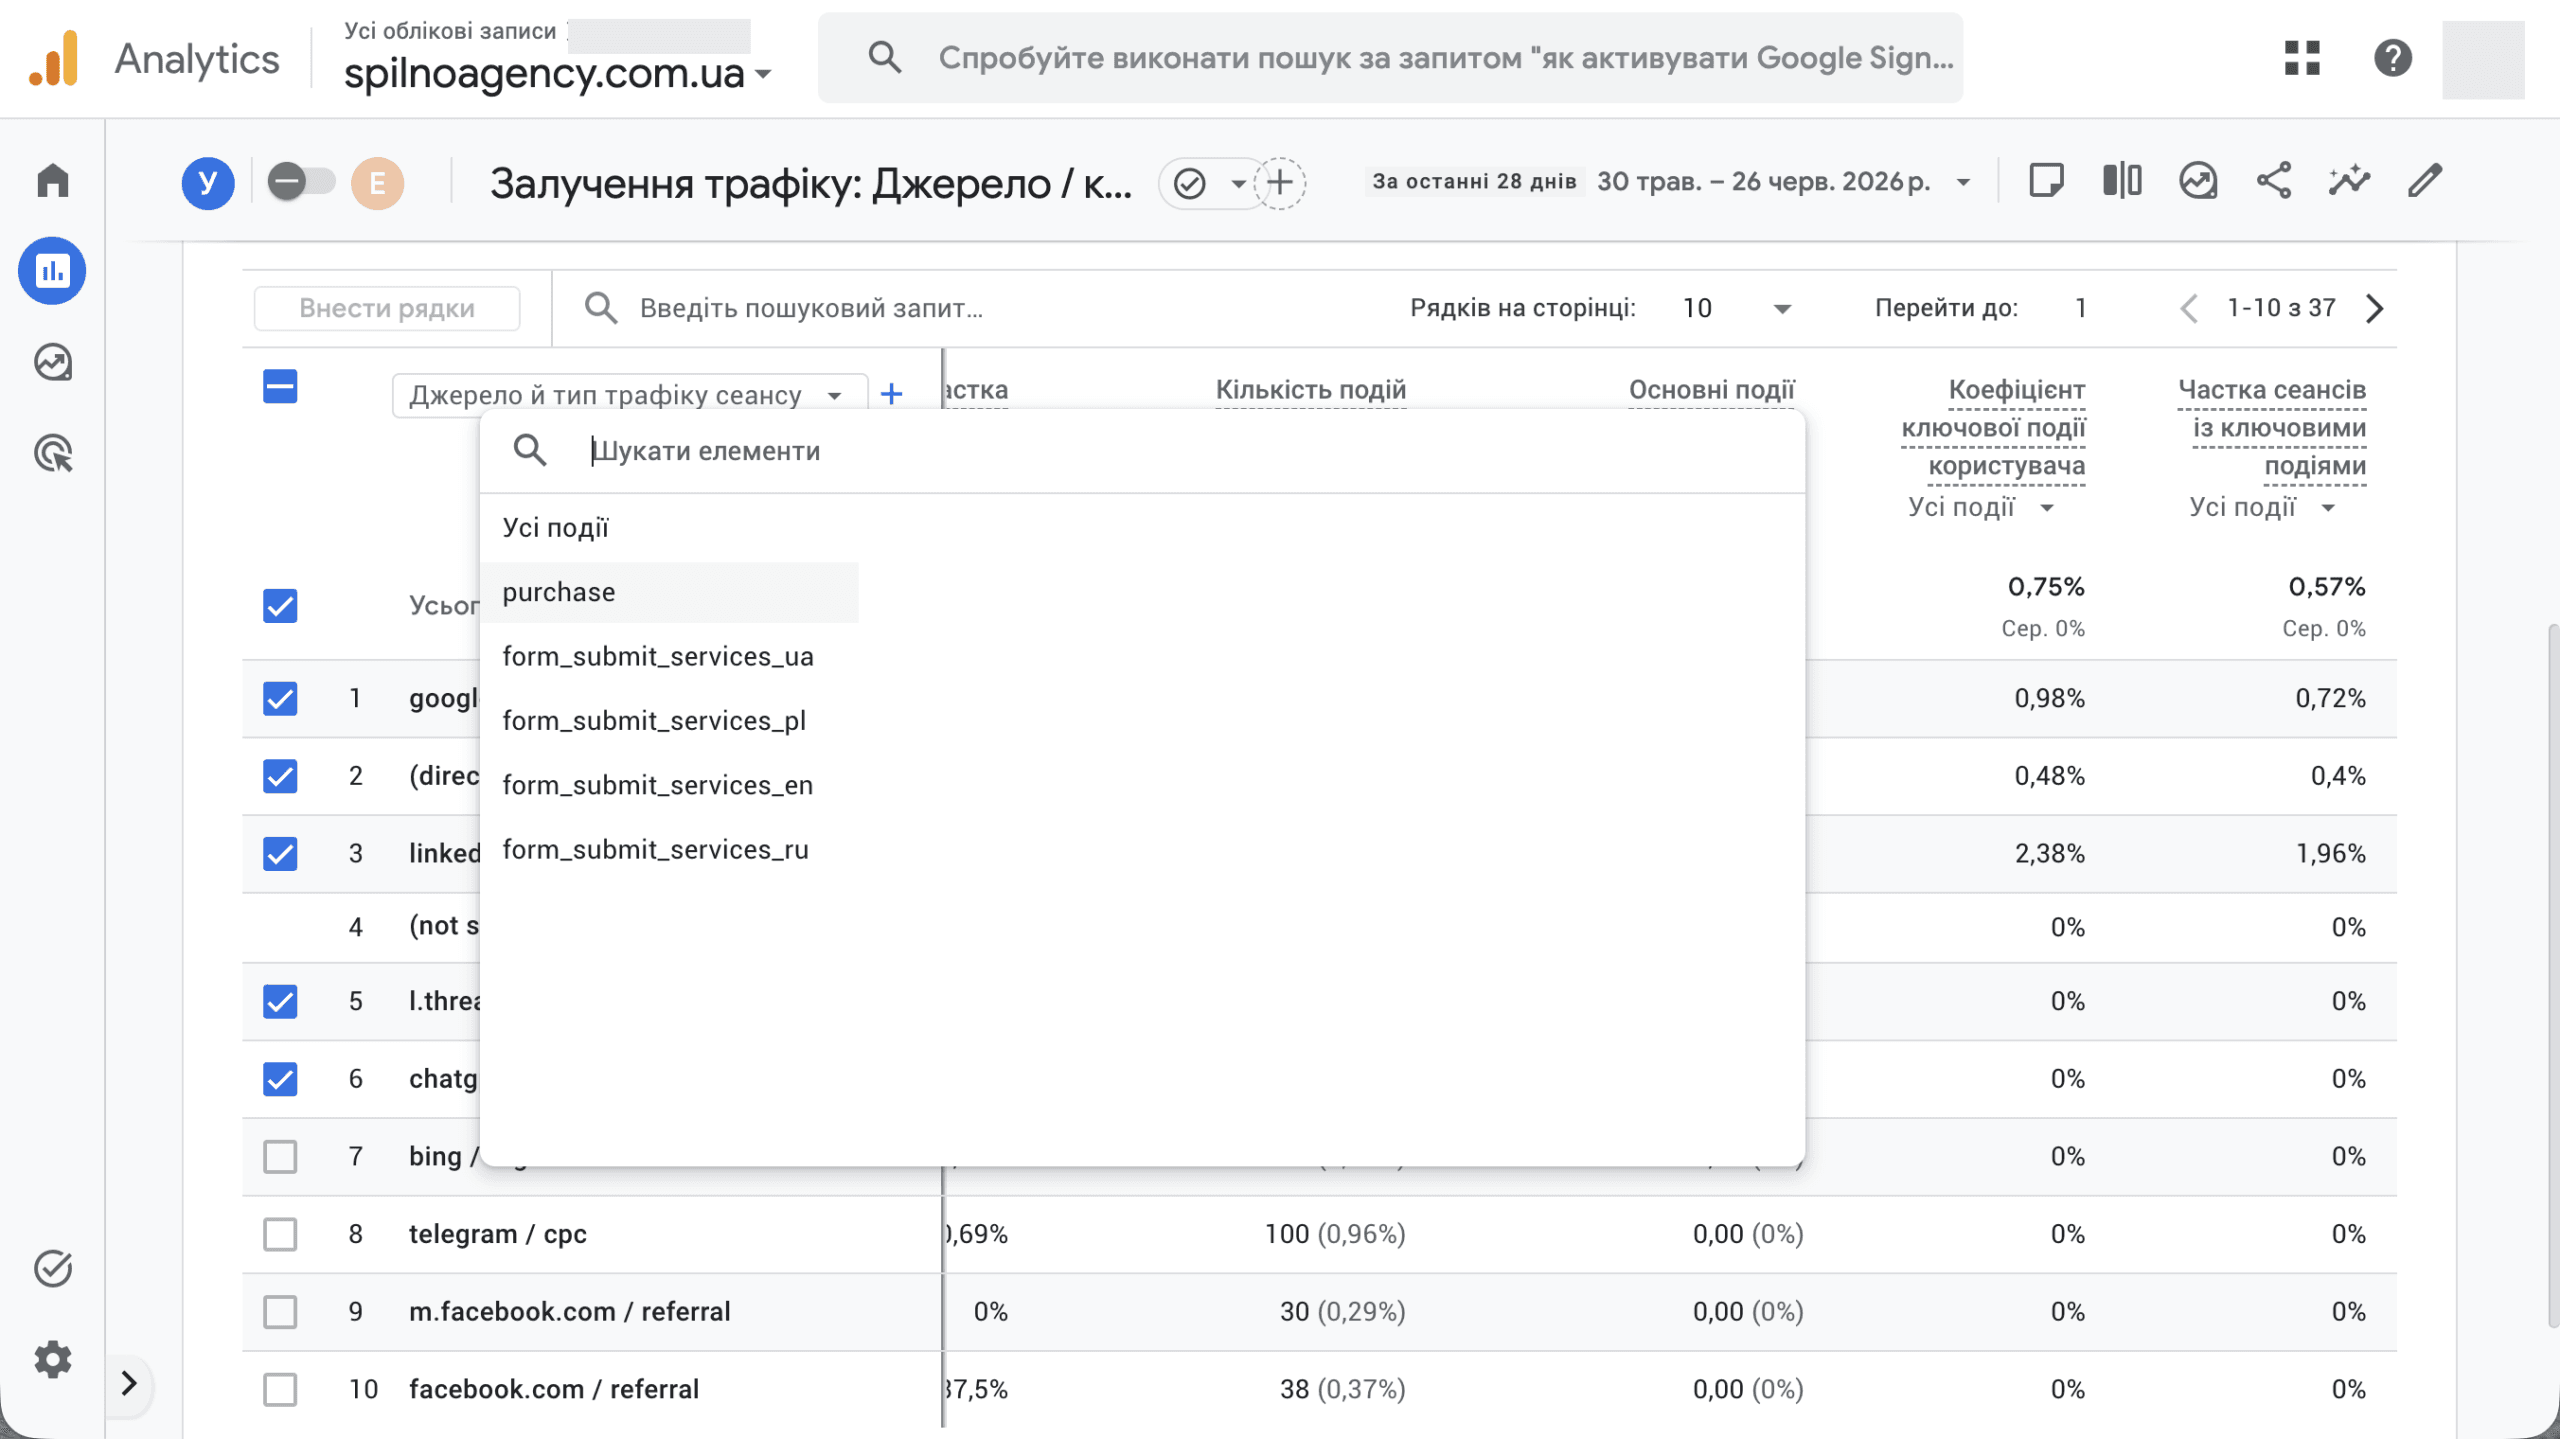
Below is the same report on a real online-store account. The revenue column and account name are hidden, but the logic is clear: google/cpc drives the volume, while the price aggregator hotline.ua and organic search show the highest key-event share. (The interface language is Ukrainian — this is a live example.)
How an online store uses the report in practice
For a store the report becomes a budget-management tool. The sequence is simple:
- Sort by Total revenue. The channels that actually bring money rise to the top. Often these are
google/cpc,google/organicand price aggregators. - Calculate revenue per session. Divide a channel’s revenue by its sessions. This is a fairer comparison than absolute numbers: a lower-volume channel with higher revenue per session is a candidate for scaling.
- Find the “traffic without money”. Channels with thousands of sessions and zero revenue are either a tracking problem (see below) or simply a channel that does not sell. Either way it is a signal to investigate, not to keep paying blindly.
- Compare against spend. Match a channel’s revenue to its ad budget in Google Ads / Meta and you get a rough ROAS per source right inside analytics.
A service business does the same, but instead of revenue it looks at key events — leads and calls. The logic is identical: which channel delivers the most target actions at the lowest cost.
What historical data reveals — and how to build a channel plan
One weekly report is a photo. The report over 6–12 months is a film that reveals strategy. By comparing periods (the date-comparison toggle at the top of the report) you answer questions you cannot see in a single moment:
- Which channels grow and which fade. If
google/organicsteadily adds revenue quarter after quarter, SEO works and deserves more investment. - Which channel converts best into sales. Not by volume, but by conversion rate and revenue per session. These are your workhorses.
- Where money is wasted. A channel with historically low conversion and high spend is a candidate to cut or rework.
- Seasonality. Which channels spike in peak season and which hold the base off-season.
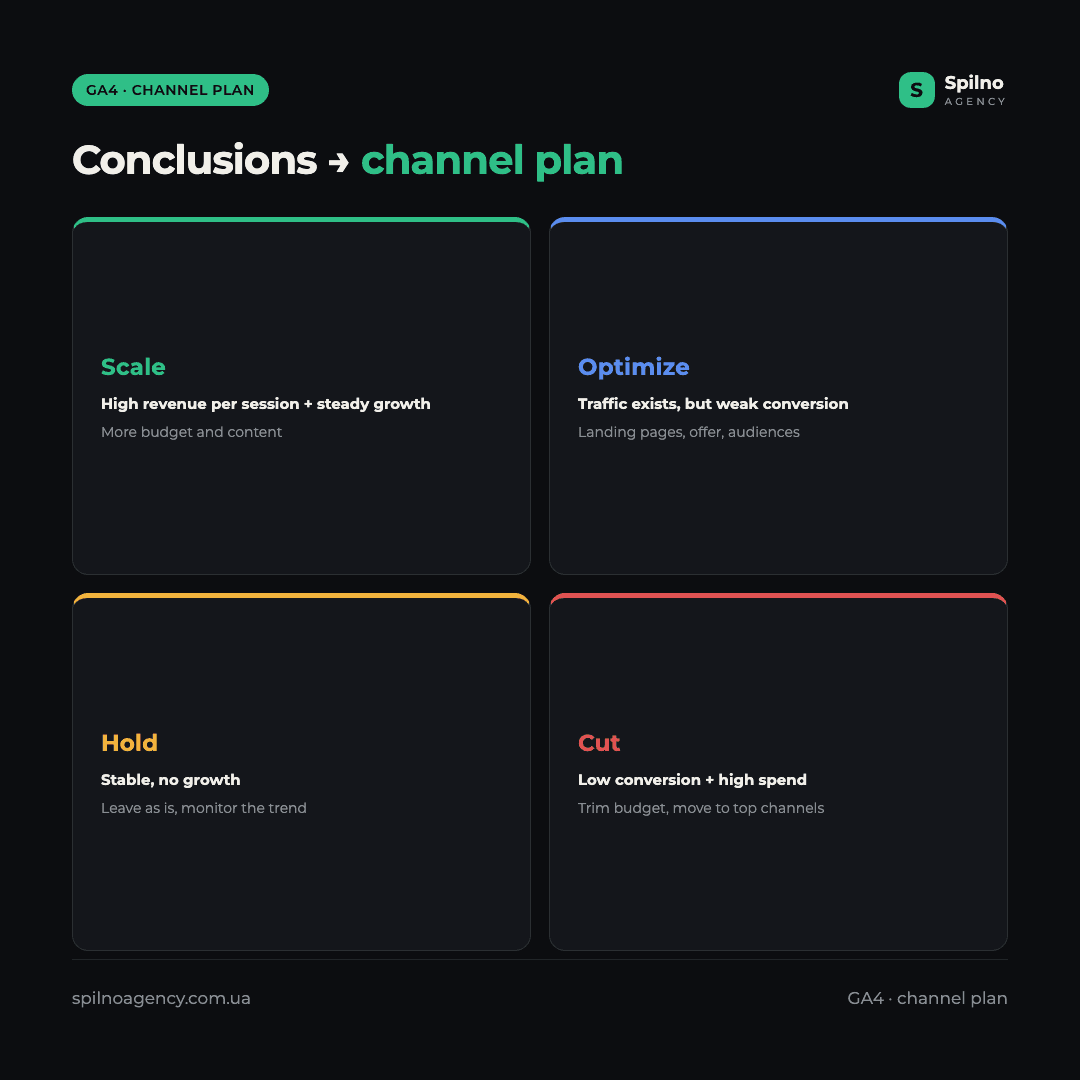
These conclusions are exactly what a digital channel growth plan is built on: channels with high revenue per session — scale (more budget, more content); channels with potential but weak conversion — optimize (landing pages, offer, audiences); ballast channels — cut and pour the freed budget into the first two groups. This is not intuition but decisions backed by numbers from a single report.
What to do if revenue and transactions are not tracked
The most common problem: the Total revenue column shows zeros, or only part of the sales. The report is powerless if data does not reach it. The usual causes:
- The
purchaseevent is not set up with avalueparameter and currency — GA4 physically does not know the order amount. - Purchases are tracked but without revenue — the event fires but the
value/currencyparameters are not passed. - Conversions are not marked as key events — Admin → Events → “Mark as key event” toggle.
- Self-referral eats the revenue from payment systems — the sale is attributed to the payment gateway instead of the real channel.
How to set this up correctly — from the purchase event to passing revenue and currency — is collected in our GA4 e-commerce verification checklist. If you need revenue and transactions tracked correctly without your involvement, that is part of the Google Analytics 4 setup service by Spilno Agency.
Event hygiene: why the report lies without it
The Traffic Acquisition report is exactly as truthful as your events are clean. Event hygiene is the discipline without which the numbers in the “key events” and “revenue” columns become unreliable. What it covers:
- Only real goals are key events. If you mark
page_vieworscrollas a key event, the conversion rate inflates and channels become incomparable. A key event = a business result (purchase, lead, call). - No duplicates. One purchase should fire one
purchaseevent. A double-firing tag overstates both conversions and revenue. - A single naming scheme.
form_submit,lead,requestfor one action are three different events and the report scatters. One result — one event name. - Pass the value. Every transactional event with
valueandcurrency, otherwise revenue in the report is incomplete. - Clean test traffic. Filter internal visits and test orders so they do not spoil channel conversion.
The rule is simple: hygiene first, conclusions second. Analyzing channels on dirty events means making budget decisions on imaginary numbers.
Why revenue and conversions don’t match your ad dashboards
A classic situation: Google Ads shows 50 conversions, GA4’s Traffic Acquisition report shows 38. This is not an error and not a reason to distrust anyone. The systems count by different rules:
- Different attribution models. GA4 uses data-driven by default (it spreads value across several touchpoints); Google Ads historically leans toward last click. The same sale is credited differently.
- Different conversion windows. Google Ads may credit a conversion 30 days after the click; GA4 works within its own window and session.
- The moment of crediting. Google Ads attributes the conversion to the click date, GA4 to the date of the event itself. At period edges the numbers diverge.
- Deduplication and consent (Consent Mode). Some events are modeled or not sent because of cookie refusal — and each system handles that its own way.
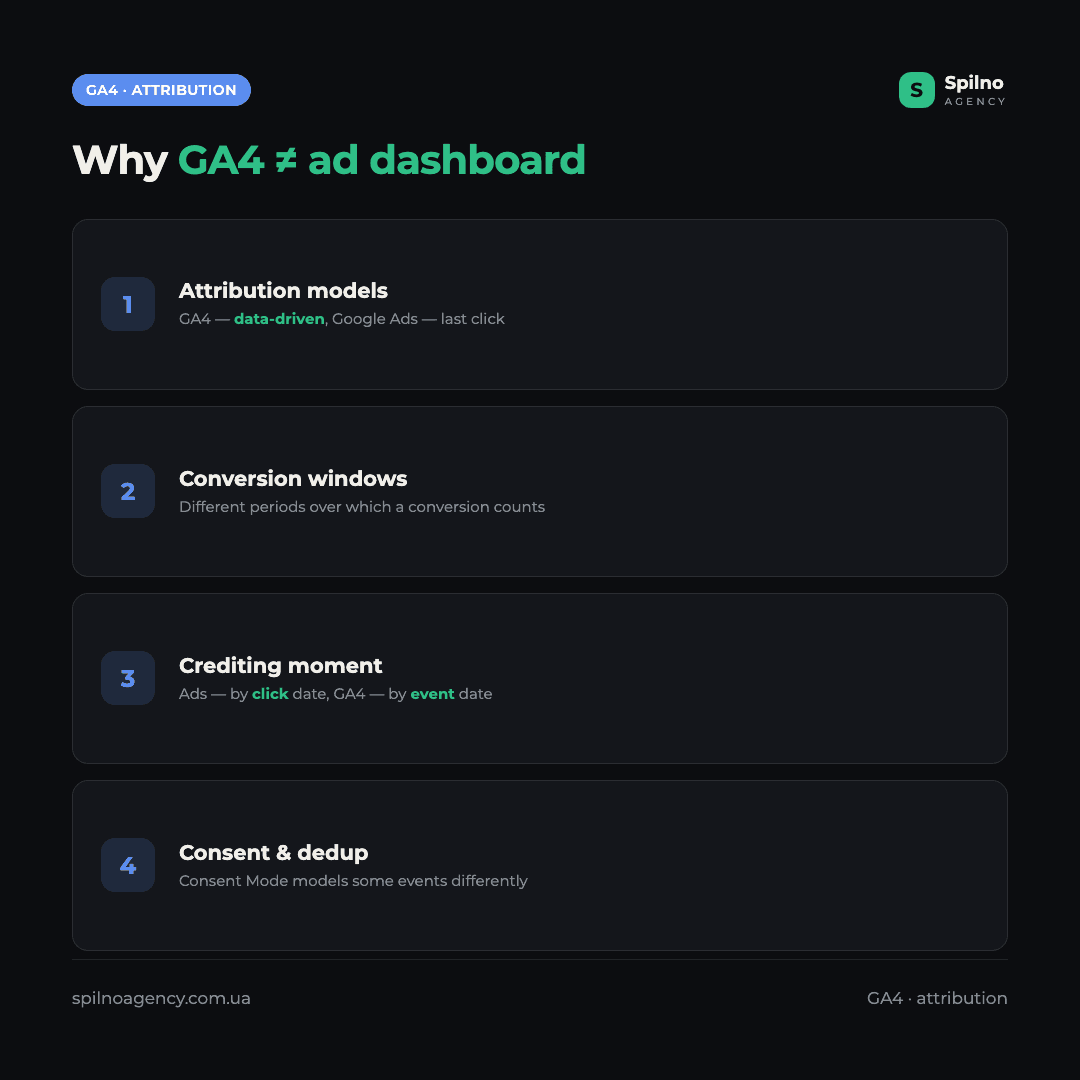
What to do about it: pick one system as the “source of truth” for each task (GA4 for cross-channel comparison and revenue, the ad dashboard for bid optimization) and do not try to reconcile the numbers to the last cent. More on the nature of cross-system differences in our guide on why data differs between analytics systems.
Checklist: how to read the report in 6 steps
- Switch the dimension to Session source / medium — the most detailed breakdown.
- Pick a period and enable comparison with the previous one to see the trend.
- Sort by revenue (or key events for services).
- Read revenue per session and conversion rate, not just volume.
- Check event hygiene and filter out self-referrals and test traffic.
- Draw conclusions → update the channel plan: scale / optimize / cut.
FAQ: the GA4 Traffic Acquisition report
How does Traffic Acquisition differ from User Acquisition?
Traffic Acquisition shows the source of every session — where the user came from this time. User Acquisition shows the source of the first encounter — where the person first arrived. To evaluate current channels and revenue you use Traffic Acquisition.
Why is the Revenue column zero when there are sales?
Most likely the purchase event is not set up, or it does not pass the value and currency parameters. GA4 does not invent revenue — it takes it from the event. Check your e-commerce tracking setup against the checklist.
What is a key event in this report?
A key event (formerly “conversion”) is a target action you marked as important: purchase, lead, call, sign-up. The report shows how many such actions each channel delivered and at what conversion rate.
Which channel counts as the best?
Not the one with the most sessions, but the one with the most revenue (or leads) per session at a reasonable cost. Always read volume, conversion and revenue together — each metric alone is misleading.
Why don’t GA4 numbers match Google Ads?
Because of different attribution models, different conversion windows, a different crediting moment (click vs event) and deduplication. It is normal. Pick one system as the “source of truth” for each task.
How often should I look at this report?
For operational control — once a week. For strategic conclusions and the channel plan — once a month over a 6–12 month trend, with period comparison.
This article is part of a free course:
Google Analytics Course
To unlock the quiz after this article and track your progress, sign up (or sign in) and start the course in your personal dashboard.
Knowledge Test
You get only 1 attempt at this quiz — read every question carefully before answering. You need at least 80% correct answers to pass.

Read also
Google Tag Manager Workspaces: Why You Need Them and How to Use Them in 2026
A workspace in Google Tag Manager is a “draft” of a container — a place to safely edit…
How to Track Revenue, Transactions and Purchases in Google Analytics 4 from WordPress WooCommerce
Introduction WooCommerce store owners are often convinced that Google Analytics 4 already shows them revenue, transaction counts and…
How to Analyze Hourly Statistics in Google Analytics 4
Google Analytics 4 has no dedicated “hourly statistics” menu item, but you can get that exact breakdown in…