Google Lighthouse: What It Is and How to Use It in 2026
Google Lighthouse is Google’s free automated tool that audits your website across four categories: Performance, Accessibility, Best Practices and SEO — each scored from 0 to 100. In 2026, Lighthouse is built into Chrome DevTools, available through PageSpeed Insights, and easily integrated into CI/CD pipelines. This guide explains what every metric means, how to run an audit, how to read the report and how to fix the most common issues.
What is Google Lighthouse
Google Lighthouse is a free, open-source automated tool developed by Google for auditing the quality of web pages. It runs a series of checks against a specific page and generates a detailed report with scores and prioritised recommendations for improvement.
Lighthouse launched in 2016 as a Chrome extension. Since 2018 it has been built directly into Chrome DevTools. Today it is an open-source project on GitHub, powers the data behind PageSpeed Insights and Google Search Console, and is used as the foundation for automated quality checks in hundreds of engineering teams across Europe and beyond.
The key advantage of Lighthouse over a plain speed test is that it doesn’t just flag a “bad score” — it explains why it’s bad and gives a concrete estimated time saving for each fix.
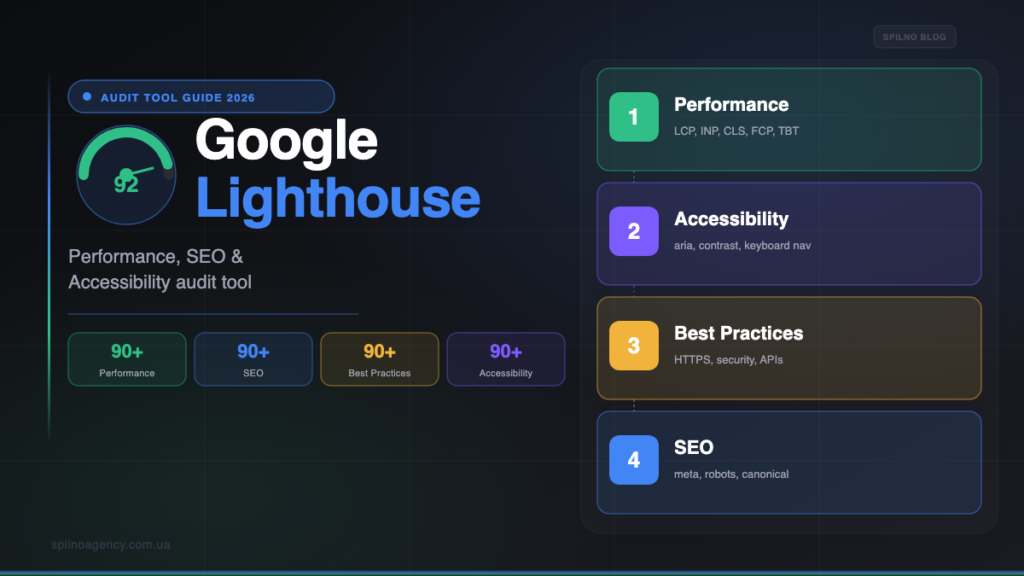
4 Categories Lighthouse Audits
Every Lighthouse report covers four separate categories. They are independent — a low SEO score does not affect your Performance score or vice versa.
1. Performance
The most important category for SEO. It measures page loading speed and interactivity through six metrics:
- LCP (Largest Contentful Paint) — time for the largest element (image, heading) to appear. Target: ≤ 2.5 s.
- INP (Interaction to Next Paint) — response time to a click or keystroke. Target: ≤ 200 ms. Replaced FID in 2024.
- CLS (Cumulative Layout Shift) — visual stability: how much elements shift during loading. Target: ≤ 0.1.
- FCP (First Contentful Paint) — time for the first visible element to appear. Target: ≤ 1.8 s.
- TBT (Total Blocking Time) — total time the main thread is blocked by JavaScript. Target: ≤ 200 ms.
- Speed Index — how quickly the visible portion fills in. Target: ≤ 3.4 s.
LCP, INP and CLS together form Core Web Vitals — Google’s official page experience signals included in the ranking algorithm.
2. Accessibility
This category checks whether your site is usable by people with disabilities — low vision users, screen reader users, keyboard-only users. It checks: image alt attributes, text contrast ratios, correct aria labels, heading hierarchy, focusable interactive elements and colour accessibility. A high Accessibility score is also an indirect SEO signal — semantic markup helps Google understand page structure.
3. Best Practices
Audits the technical health of the page: HTTPS, absence of vulnerabilities in JavaScript libraries, deprecated APIs (e.g. document.write), browser console errors, Content Security Policy headers. A high score here means your site is secure, modern and technically sound.
4. SEO
A basic technical SEO checklist for the page: presence and correctness of title and meta description tags, robots directives, canonical, hreflang, font size for mobile, structured data, robots.txt status. Note: Lighthouse SEO is a technical checklist for one page, not a full SEO audit of a site.
5 Ways to Run Google Lighthouse
1. Chrome DevTools (quickest option)
Open Chrome, navigate to the page you want to audit, press F12 or Ctrl+Shift+I (Mac: Cmd+Option+I). Switch to the Lighthouse tab, select your categories and device (Mobile / Desktop), and click Analyze page load. In 30–60 seconds you’ll have the full report right inside the browser.
Pro tip: always run Lighthouse in an incognito window (Ctrl+Shift+N) to prevent browser extensions from skewing the results.
2. PageSpeed Insights
Go to pagespeed.web.dev, enter a URL and click Analyze. PageSpeed Insights combines Lighthouse lab data with real-world data from the Chrome UX Report (CrUX) — this is where Google reads your Core Web Vitals for ranking purposes. For any SEO audit, PSI should be your primary tool.
3. Lighthouse Chrome Extension
Install the official Lighthouse extension from the Chrome Web Store. It adds a toolbar button — one click and you get results without opening DevTools. Useful for marketers and site owners who don’t need to dig into the developer panel.
4. Lighthouse CLI
For developers and automation. Install and run:
npm install -g lighthouse
lighthouse https://example.com --output=html --output-path=report.html
The CLI supports HTML, JSON and CSV output formats, custom configuration files, targeting specific categories and emulating different devices and network speeds.
5. Lighthouse CI (for engineering teams)
Lighthouse CI integrates automated audits into your CI/CD pipeline (GitHub Actions, GitLab CI, CircleCI). It lets you run checks on every pull request and set thresholds — for example, “block the merge if Performance Score drops below 85”. This is the production-grade best practice for teams serious about Core Web Vitals.
How to Read the Lighthouse Report
After an audit completes, Lighthouse shows four score circles. Below them is a detailed checklist grouped by category. Each audit item has one of three states:
- 🟢 Passed audits — no action needed.
- 🟠 Opportunities — specific time savings available (e.g. “Serve images in next-gen formats: save 2.1 s”).
- 🔴 Diagnostics — a potential issue affecting the score.
Real Lighthouse Audit Example
Here is what a real Lighthouse report looks like — using spilnoagency.com.ua/blog as an example — and what each part means:
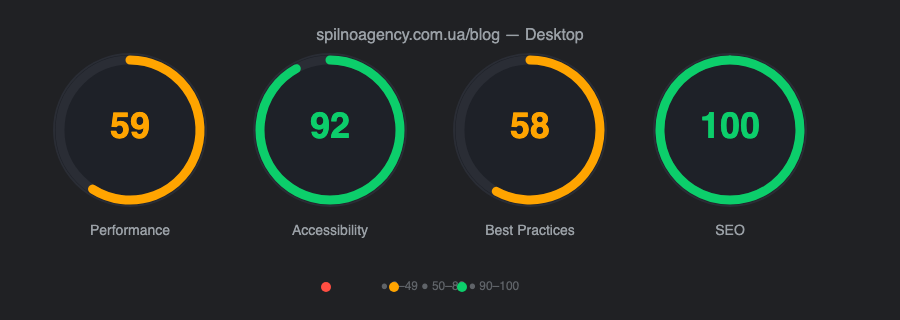
The first screen after the audit completes — 4 score circles: Performance 59 (orange — needs work), Accessibility 92 (green — good), Best Practices 58 (orange), SEO 100 (green — perfect). These 4 numbers are the starting point of any technical SEO audit.
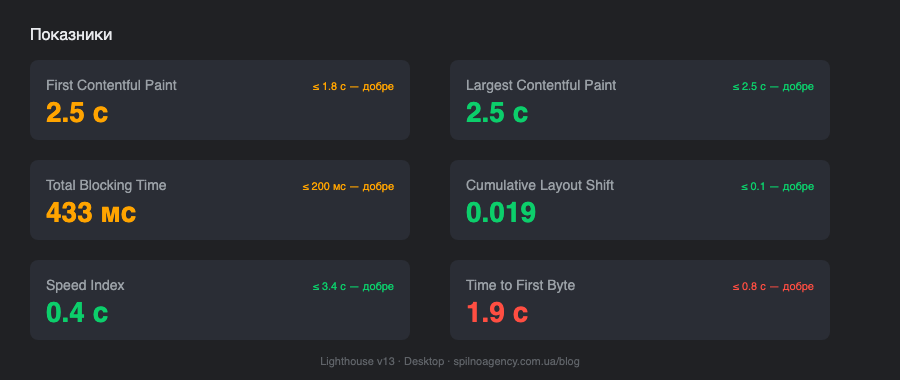
Expanded Performance metrics: FCP (First Contentful Paint) 2.5s — first element on screen; LCP (Largest Contentful Paint) 2.5s — main content element; TBT (Total Blocking Time) 433ms — main-thread blocking time; CLS (Cumulative Layout Shift) 0.019 — layout stability; Speed Index 0.4s — how quickly the viewport fills. Green = passing, orange = needs improvement.
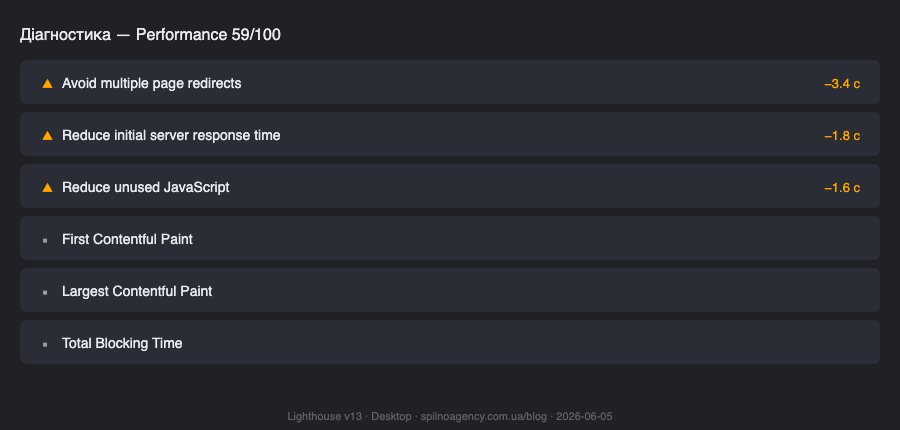
The Opportunities & Diagnostics section shows concrete recommendations with estimated time savings. It highlights unoptimized images, render-blocking scripts, and unused CSS. This list is your optimization roadmap — start with the items showing the largest potential time savings.
Where to start fixing? Begin with Opportunities that have the largest estimated saving in seconds — Lighthouse sorts them by impact. Only move on to Diagnostics once you’ve addressed the biggest wins.
Core Web Vitals in Lighthouse
Core Web Vitals are the three metrics Google designated as the key indicators of user experience quality. Since 2021 they are an official ranking signal (Google Page Experience).
- LCP (Largest Contentful Paint): ≤ 2.5 s — Good; 2.5–4 s — Needs Improvement; > 4 s — Poor. Typically the hero image, video or large text block.
- INP (Interaction to Next Paint): ≤ 200 ms — Good; 200–500 ms — Needs Improvement; > 500 ms — Poor. Measures click and keypress response delay.
- CLS (Cumulative Layout Shift): ≤ 0.1 — Good; 0.1–0.25 — Needs Improvement; > 0.25 — Poor. Buttons and text that jump around during loading.
Important: Lighthouse measures CWV under lab conditions (a synthetic test). For real-world CWV, check PageSpeed Insights or Google Search Console → Core Web Vitals.
How to Improve Your Performance Score
The most impactful actions for raising your Performance score, ordered by effect:
- Optimise images. Convert to WebP/AVIF, compress without visible quality loss, specify
widthandheightattributes, useloading="lazy"for below-the-fold images. Lighthouse will tell you exactly which images are the heaviest. - Eliminate render-blocking resources. Load scripts with
deferorasync, inline critical CSS, defer non-critical stylesheets. - Enable browser caching. Set
Cache-Controlheaders for static assets (JS, CSS, images) — at least 1 year for versioned files. - Reduce server response time (TTFB). Use a CDN, server-side caching (Redis, LiteSpeed Cache for WordPress), optimise database queries.
- Reduce JavaScript size. Remove unused code (tree shaking), split bundles (code splitting), audit heavy third-party scripts (analytics, live chat, maps).
- Fix CLS. Set explicit dimensions on images and video (so the browser reserves space before they load), avoid injecting content above the fold dynamically.
How to Improve Your Lighthouse SEO Score
An SEO Score of 100 is relatively easy to achieve compared with Performance. The most common causes of a low score and how to fix them:
- Missing or too short
meta description→ add a unique description of 120–160 characters. - Missing or incorrect
titletag → every page needs a unique title of 50–60 characters. - Page blocked by robots.txt or
noindex→ review directives; indexed pages should not have these. - Text too small for mobile (below 12 px) → set a minimum body font size of 14–16 px.
- Links with non-descriptive anchor text (“here”, “read more”) → replace with semantic text describing the destination.
- Images without
altattributes → add descriptive alt text to all meaningful images. - Missing
hreflangfor multilingual sites → required for sites serving multiple language versions.
What’s New in Lighthouse in 2026
Lighthouse is actively developed. Key changes from recent versions that are relevant in 2026:
- INP replaced FID (since Lighthouse 10, March 2024). Interaction to Next Paint (INP) more accurately reflects interaction delay throughout the entire page visit, not just the first click.
- Long Animation Frames (LoAF) metric — Lighthouse now accounts for long animation frames that degrade INP.
- Improved detection of AI-generated content issues — Best Practices now flags outdated LLM-related browser APIs.
- Lighthouse CI v13 — significantly simplified YAML configuration for GitHub Actions.
- Chrome Recorder integration — run Lighthouse against recorded user flows (not just static page loads).
Frequently Asked Questions about Google Lighthouse
Does Lighthouse affect Google rankings?
Not directly. Google does not use “Lighthouse Score” as a ranking signal. However, Lighthouse measures Core Web Vitals (LCP, INP, CLS) and overall page speed, which are part of Google’s Page Experience signals. So improving your Lighthouse Performance score indirectly helps SEO — but it’s not a direct cause-and-effect relationship.
Why does Lighthouse show different results each time?
Lighthouse runs a synthetic test on your local machine, so results depend on CPU load, network conditions at the time of the audit, browser extensions and cache state. For stable results: use an incognito window, run the audit 3–5 times and average the scores, or use PageSpeed Insights (server-side run in a standardised environment).
What is the difference between Mobile and Desktop in Lighthouse?
Mobile mode emulates a slower device (4× CPU throttling) and a 4G mobile network speed, so scores are typically lower. Desktop runs without throttling. Since Google primarily uses mobile-first indexing, the Mobile score matters more for SEO. Check both modes — Google is gradually introducing more nuanced device-specific indexing in 2026.
How long does it take to fix Lighthouse Performance?
It depends on your site’s current state. Basic improvements (image optimisation, caching, script deferral) take 4–8 hours and can raise a score from 50 to 80+. Deep optimisation (JavaScript refactoring, TTFB reduction, CLS fixes) is a separate project lasting 1–4 weeks depending on site complexity.
Read also
cPanel SEO: How to Optimize Your Hosting for Search in 2026 (Enable & Disable)
cPanel is a hosting control panel that packs dozens of features with a direct impact on SEO: HTTPS…

Cloudflare for SEO: How to Configure It to Improve Search Performance in 2026
Cloudflare works as a proxy and CDN between the visitor and your website, and it can noticeably affect…

How Spilno Agency Does On-Page SEO Optimization with Claude
Spilno Agency runs on-page SEO optimization together with the AI agent Claude — following one document standard that…