Website Heatmap: How to Use It for SEO and Paid Ads
A website heatmap shows where users click, how far they scroll, and what captures their attention. Microsoft Clarity is a free tool from Microsoft that provides this data with no session limits. This guide covers how to read heatmaps and use them for SEO, Google Ads, and paid social campaigns.
What is a website heatmap
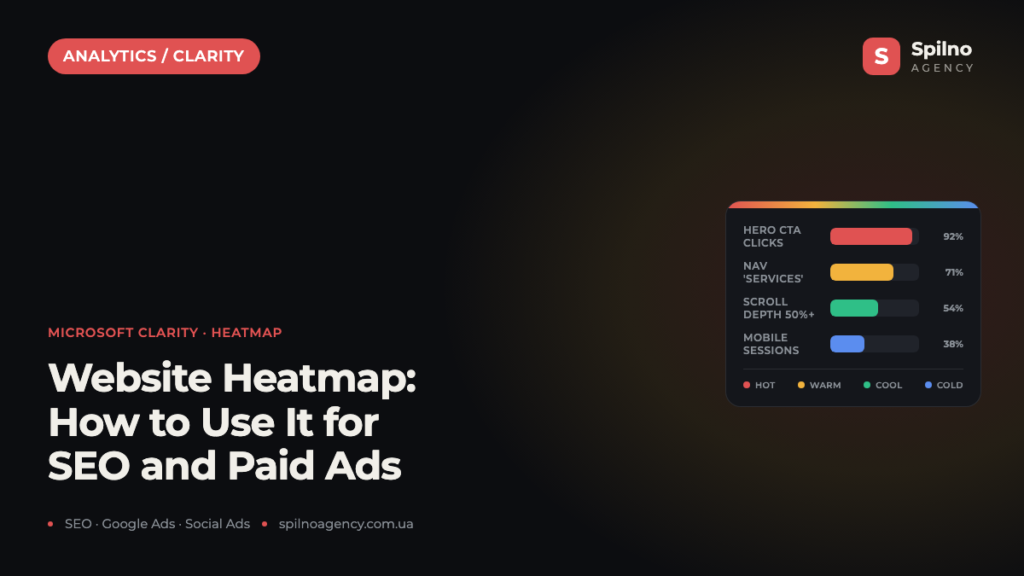
A heatmap is a visual report showing user activity on a page. Red zones indicate the highest activity, blue and green zones the lowest. The name comes from thermography: the “hotter” the zone, the more interactions occurred there.
Heatmaps answer questions that Google Analytics cannot: exactly where on the page people click, how far they scroll, and what they ignore. This is behavioural analytics — a complement to quantitative metrics.
Three types of heatmaps
- Click Map — shows where users click. Reveals non-functional elements that look like links, and real CTA zones;
- Scroll Map — shows what percentage of the page users reach. Helps determine where to place key content and CTAs;
- Attention Map — a combined metric showing where users spent the most time. Identifies zones of genuine interest.
Microsoft Clarity — a free heatmap tool
Microsoft Clarity is a free analytics tool from Microsoft that provides heatmaps and session recordings with no limits on the number of views and no paid plans. Unlike Hotjar or Crazy Egg, Clarity is completely free even for high-traffic websites.
What Microsoft Clarity offers
- Three heatmap types — click, scroll, attention — for any page on your website;
- Session recordings — video recordings of user behaviour: mouse movements, clicks, scrolling;
- Segmentation — filtering by device, traffic source, URL, date, and behaviour;
- Automatic issue detection — Clarity automatically flags rage clicks, dead clicks, and excessive scrolling;
- Google Analytics 4 integration — passing Clarity data to GA4 as custom dimensions;
- AI Copilot — a built-in AI assistant for analysing recordings and finding patterns.
How to connect Microsoft Clarity to your website
- Register at clarity.microsoft.com — free, via a Microsoft account;
- Create a new project: enter the name and URL of your website;
- Get the tracking code and insert it into the
<head>of your site — or use a WordPress plugin or GTM; - Wait for the first data to appear — usually 1–4 hours after activating tracking;
- Go to the Heatmaps section and select the URL you want to analyse.
Connecting via GTM (Google Tag Manager) is the most convenient option: it requires no access to the site’s code, and the Clarity tag is already in GTM’s template library.
How to read heatmaps in Microsoft Clarity
The screenshots below show three heatmap viewing modes for the spilnoagency.com.ua homepage, collected over 3 days. Here is what the data shows:
Click Map: where users click
The click map shows numeric labels on each interactive element — the number of clicks and the percentage of total clicks. For the homepage, the most clicks go to:
- The “Contact us” button in the header (15% of all clicks);
- Navigation menu items — Services, Industries, Cases;
- The “Get a consultation” button in the hero section.
The click map helps identify dead elements — buttons or images that users click but which lead nowhere. This is a direct UX optimisation signal.
Scroll Map: where visitors drop off
On the scroll map, red indicates upper zones (100% of users see them), yellow and green indicate further down the page (less than 50%), and blue indicates the lowest sections (less than 20%). The “Average page fold position” marker shows where the average bottom edge of the visible screen falls — this is the key point for CTA placement.
Attention Map: where real interest is concentrated
The attention map uses a blue-green-yellow gradient to show where users spent the most time. Unlike the click map, it accounts for dwell time — even without clicks. This helps identify zones where content generates interest but does not convert.
Heatmap for SEO: practical applications
SEO specialists use heatmaps for two key tasks: improving behavioural factors and optimising content structure.
Reducing bounce rate
If the scroll map shows that 70% of users leave after the first screen — this is a signal that the hero section does not meet expectations or the call to action is not clear enough. Changes to the structure of the first screen directly affect dwell time and page depth.
Optimising internal linking
The click map shows which links in articles are actually clicked. If an internal link to an important page gets zero clicks — consider changing its position, anchor text, or visual emphasis. Internal links that are clicked pass page authority more effectively.
Optimising article structure
The scroll map for blog articles shows how far readers go through the content. If 80% of readers stop at the second H2 — consider moving the key argument or FAQ section higher. For SEO, this means a stronger E-E-A-T signal through deeper reading.
Identifying mobile version issues
Clarity lets you switch the heatmap between desktop and mobile. If the mobile click map shows chaotic tapping — buttons are likely too close together or not scaling correctly. This is a typical issue that lowers Core Web Vitals scores.
- Scroll Map → determines where to place a key link or FAQ block for maximum coverage;
- Click Map → identifies which anchor links actually work and where users navigate;
- Filter “Organic search” → analyse only organic traffic, without skewing data with ad traffic;
- Before/after comparison — Clarity stores heatmap snapshots for comparing changes.
Heatmap for Google Ads: conversion optimisation
PPC specialists use heatmaps to analyse landing pages — the pages that ads point to. The key principle: if paid traffic is not converting, the problem is often not the ad itself but the landing page.
Landing page analysis through traffic segmentation
In Clarity, you can segment the heatmap by UTM parameters: for example, show only sessions with utm_source=google and utm_medium=cpc. This lets you see how paid traffic specifically behaves — whether there is message match between the ad promise and the page content.
Key scenarios for Google Ads
- Message Match — if the ad says “free audit”, the attention map should show activity around that offer on the landing page;
- CTA position — the scroll map shows what percentage of paid traffic reaches the conversion button. If less than 30% — move the CTA higher;
- Forms and interactive elements — the click map reveals whether users are clicking on form fields and whether there are rage clicks on the submit button;
- A/B landing page testing — comparing heatmaps of two page versions shows which version retains attention better.
Clarity + Google Ads integration
Clarity integrates with GA4, and GA4 connects to Google Ads. This allows you to import conversions from Clarity events into Google Ads and use behavioural signals to optimise Smart Bidding. Setup takes up to 30 minutes and requires no programming.
Heatmap for paid social (Meta Ads)
Social media advertising specialists face the same problem as PPC specialists: ads drive traffic, but there are no conversions. Heatmaps help localise the problem on the website side.
Key scenarios for paid social specialists
- Social traffic analysis — filtering by utm_source=facebook or utm_source=instagram shows how Meta Ads audiences behave;
- Mobile optimisation — Meta and TikTok traffic is predominantly mobile; the mobile heatmap reveals UX issues;
- Creative-to-landing alignment — if the ad shows a product, the attention map should show activity around that product’s image on the page;
- Rage clicks — an automatic Clarity feature; rage clicks on a landing page indicate broken functionality or confusing UI;
- Session recordings — watch several sessions from ad traffic to see the real user journey from ad click onwards.
Session recordings: a complement to heatmaps
Clarity records each session as a video. This allows you to not just see “where people clicked” but trace the entire journey of a specific user. Particularly useful for:
- Diagnosing form problems — exactly where the user stopped and left;
- Identifying technical bugs — if multiple recordings show the same error;
- Analysing e-commerce funnels — where buyers drop off during checkout;
- Comparing new vs returning visitors — Clarity allows filtering by this parameter.
Common mistakes when analysing heatmaps
- Too small a sample — a heatmap with 30 sessions is not representative. You need at least 200–500 sessions per page for statistical significance;
- Ignoring segmentation — a general heatmap mixes different audiences. SEO traffic and paid traffic behave differently;
- Analysis without context — high activity in a certain zone does not always mean success. If clicks are concentrated on the FAQ instead of the CTA — that is a problem;
- Ignoring devices — always analyse desktop and mobile separately. Behaviour differs dramatically;
- One-time check — a heatmap shows the state at the time of data collection. After changes to the page, a new analysis is needed.
FAQ: common questions about heatmaps
Is Microsoft Clarity free?
Yes, Microsoft Clarity is completely free. There are no limits on the number of sessions, recordings, or pages. Microsoft monetises the tool indirectly — by promoting Azure and other company products.
How long does Clarity store data?
Data in Microsoft Clarity is stored for 13 months. After this period, session recordings and heatmaps are deleted. If you need long-term storage — export the data or use the GA4 integration.
Does Clarity affect website speed?
The Microsoft Clarity script loads asynchronously and does not block page rendering. The impact on Core Web Vitals is minimal. According to Microsoft, the compressed script weighs approximately 17 KB.
Is Clarity GDPR compliant?
Microsoft Clarity is GDPR compliant. The tool automatically masks sensitive fields (passwords, card numbers). However, for sites serving European users, it is recommended to add Clarity to Consent Mode v2 and update the Privacy Policy to mention behavioural data collection.
Can Clarity be used alongside Google Analytics 4?
Yes. Microsoft Clarity has built-in GA4 integration: once activated in the Clarity Dashboard, session data appears in GA4 as custom dimensions. You can analyse rage click or dead click segments directly in GA4 Exploration.
What is the difference between a heatmap and an A/B test?
A heatmap shows behaviour with the existing design — where people click and scroll right now. An A/B test compares two page versions and measures the difference in conversions. These tools complement each other: the heatmap generates a hypothesis for changes, the A/B test validates its effectiveness.
Conclusion
Website heatmaps are an essential tool for any specialist working with websites: SEO professionals, PPC managers, and paid social specialists. Microsoft Clarity provides this data for free and without limits, with insights comparable to paid tools.
Setting up Clarity takes 10–15 minutes. The first insights appear within 24–48 hours of launch. Start with the scroll map of the landing page receiving paid traffic — and you will almost certainly find an optimisation point that GA4 was missing.
Read also
Spilno Agency’s Experience: How We Verify Events Before Starting Work
Before launching a campaign in Google Ads or Meta Ads, or starting SEO work, Spilno Agency always checks…
GA4 DebugView: How to Verify Google Analytics Events in Real Time
DebugView is the section of Google Analytics 4 that shows your site’s events in real time, seconds after…

Top Claude Skills for TikTok Ads Specialists (2026)
9 verified Claude skills and MCP servers for TikTok Ads: Pixel/Smart+ audits, Spark Ads hook/hold rate, creator sourcing,…