GA4 DebugView: How to Verify Google Analytics Events in Real Time

DebugView is the section of Google Analytics 4 that shows your site’s events in real time, seconds after they fire, instead of the usual 24–48 hour reporting delay. This article isn’t a rehash of Google’s documentation — it’s a practical test: on our own site we typed a test comment under an article and show, step by step, how the form_submit event appears in DebugView right after submitting it. We also cover why DebugView doesn’t work without Google Tag Manager or Tag Assistant, and what to do if an event never shows up.
What DebugView is and why it matters
DebugView is a report inside Google Analytics 4, found under Admin → Data display → DebugView. Unlike GA4’s regular reports, where data is processed and aggregated with a delay, DebugView shows the live event stream from one specific debug device — a chronological feed, exactly like the real screenshots further down this article.
The main reason to open DebugView instead of waiting for a regular report is feedback speed. When you’ve just configured a new event in GTM or changed something in the site’s code, waiting a day or two to find out whether it actually worked is simply too slow. DebugView answers that question in seconds.
DebugView and Google Tag Manager — a required pair
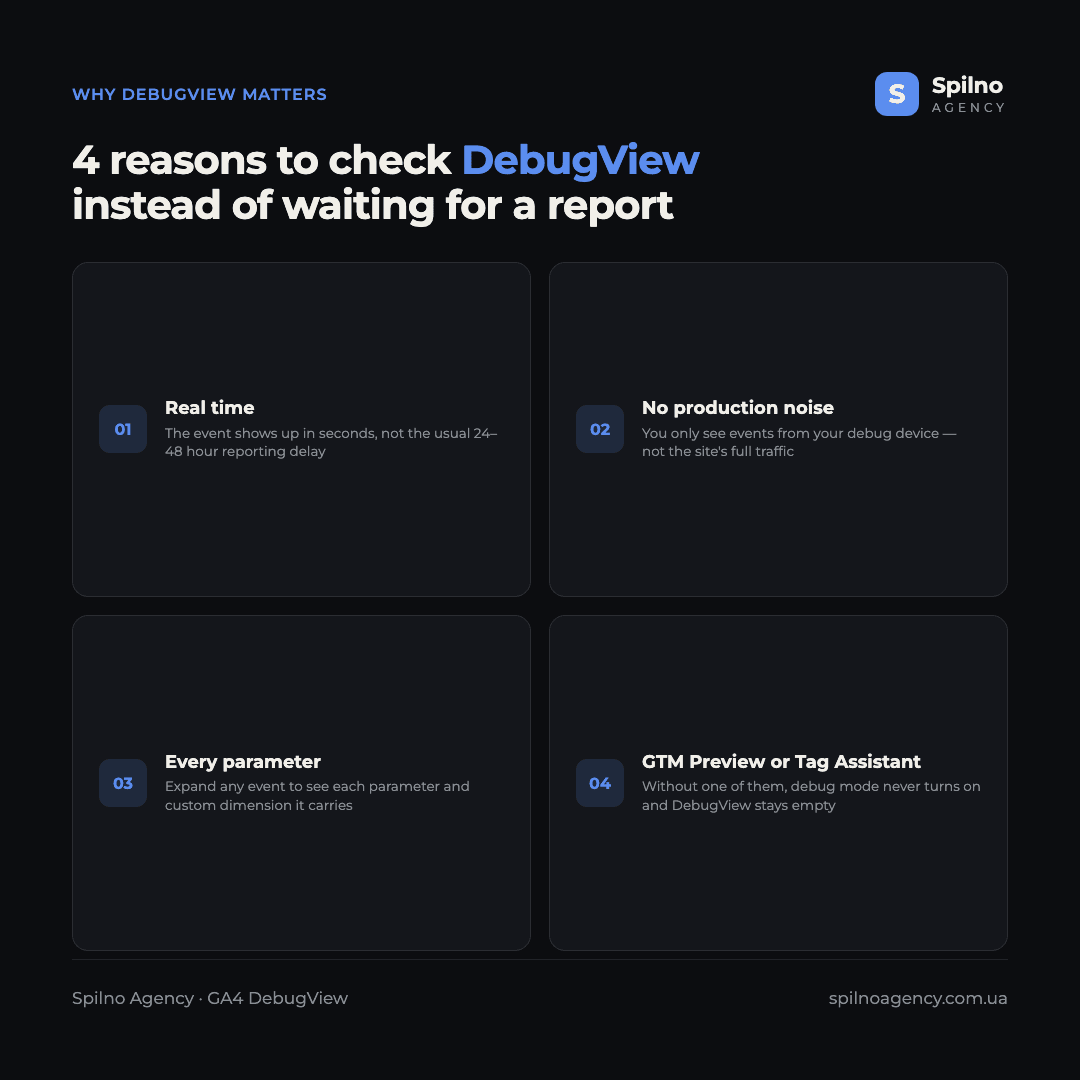
Here’s the detail that trips up most beginners: DebugView doesn’t turn anything on by itself. It only displays events sent from a device that’s explicitly flagged as a debug source. If no device is marked that way, the report stays empty — even if the site is getting thousands of real visitors every minute.
Debug mode gets switched on in one of three ways, and in most real setups GA4 works together with Google Tag Manager:
- GTM Preview mode — the most common route. Open the Google Tag Manager container, click “Preview”, and GTM automatically appends
debug_mode: trueto every GA4 tag for that session. - The Google Tag Assistant Chrome extension — turns on the same debug mode without opening GTM at all, handy for a quick check of any site, including one you don’t manage.
- A manual parameter in the code — if GA4 is wired up directly via
gtag.js, without GTM, debug_mode can be enabled by hand.
For the third option, the code looks like this:
gtag('config', 'G-XXXXXXXXXX', {
  'debug_mode': true
});
That’s exactly why the brief for this article insisted on testing DebugView together with Google Tag Manager, not in isolation. If the GA4 Configuration tag in GTM isn’t published — or doesn’t exist at all — DebugView will show nothing, and the actual problem sits in the GTM container feeding it, not in GA4 itself.
Tested in practice: verifying a comment-form submission
Instead of just retelling Google’s documentation, we ran a live test on our own site, spilnoagency.com.ua, with a real GTM container and a real blog article. The goal: confirm that GA4 captures the event when someone submits a comment under an article, and watch the entire chain unfold inside DebugView.
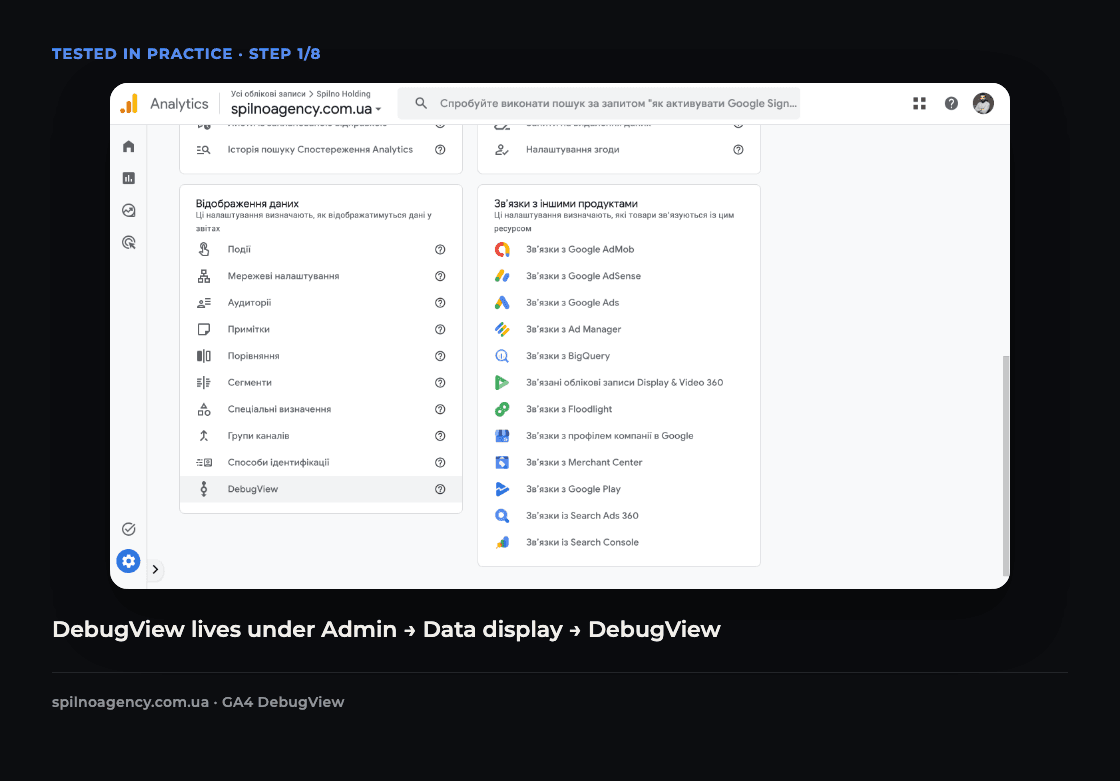
Step one is finding the report itself. It lives in the property admin’s lower-left menu, in the “Data display” block, alongside “Audiences” and “Identity”
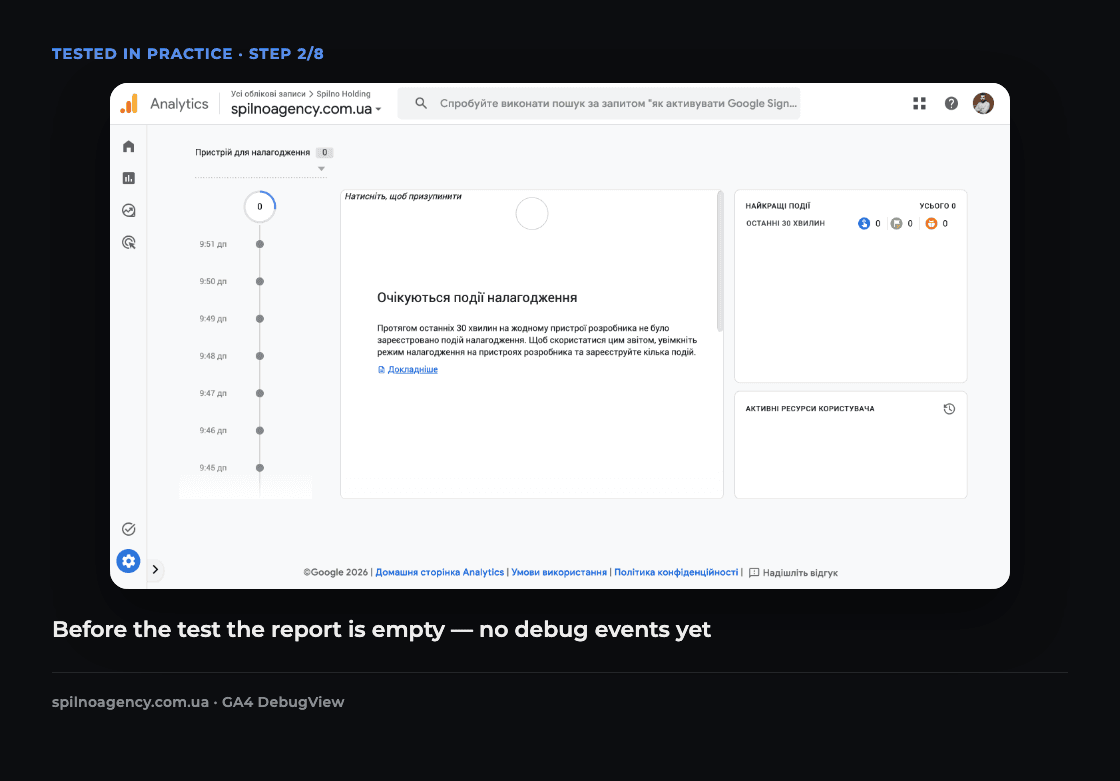
Before doing anything, the report is empty: “Waiting for debug events. In the last 30 minutes, no debug events have been logged on any developer device.” That’s the normal starting state — DebugView hasn’t seen a debug device yet.
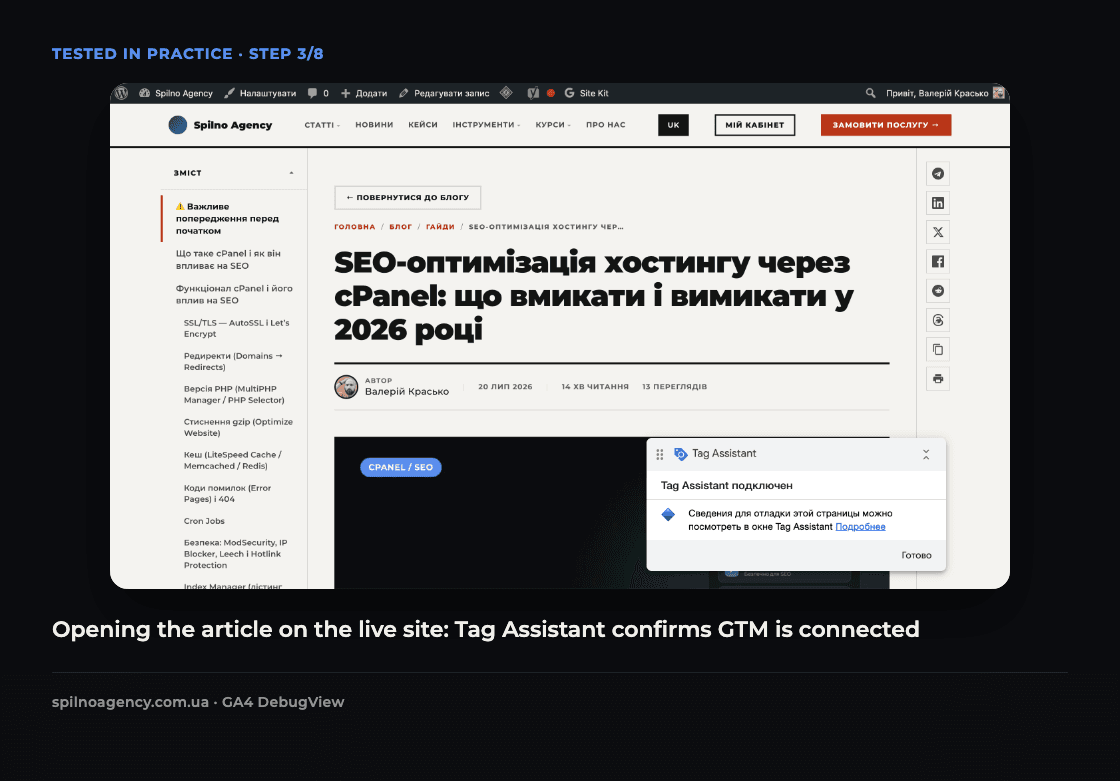
Next, we open the target page with Tag Assistant turned on — the extension confirms “Tag Assistant connected”, which flags the current tab as a debug device.
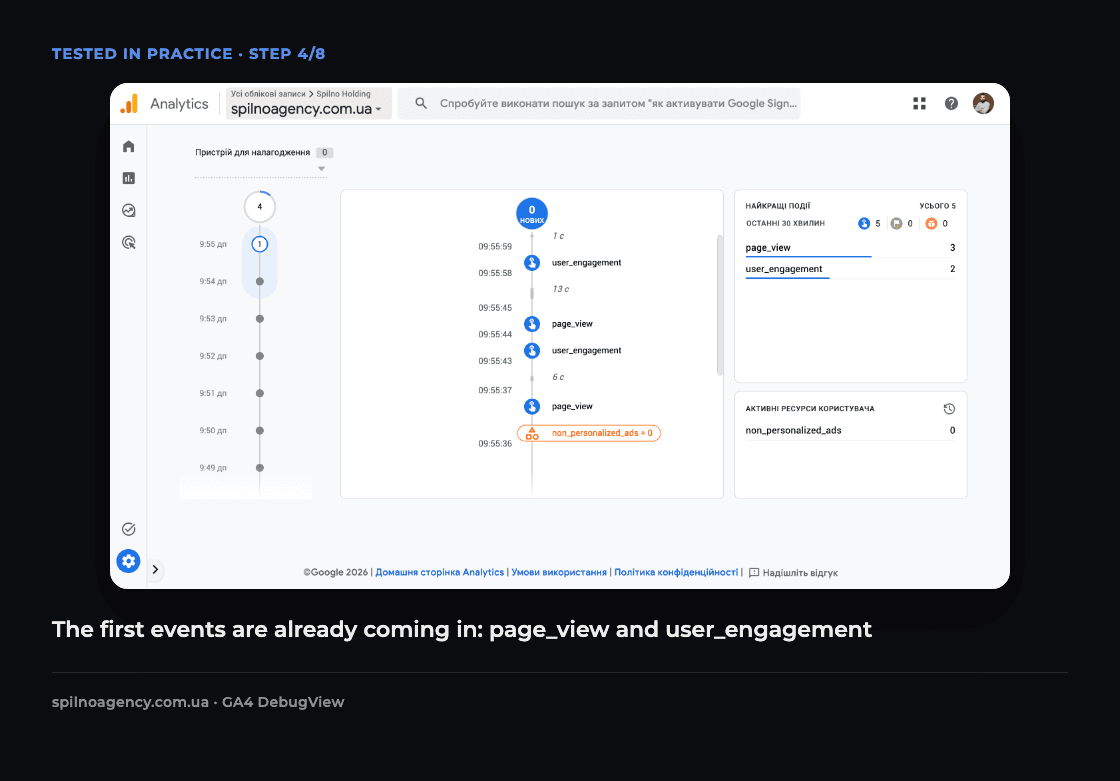
Within seconds, DebugView comes alive: the event feed shows the standard automatic events — page_view and user_engagement. That confirms the “site → GTM → GA4 → DebugView” chain is working correctly, before we even run our own test.
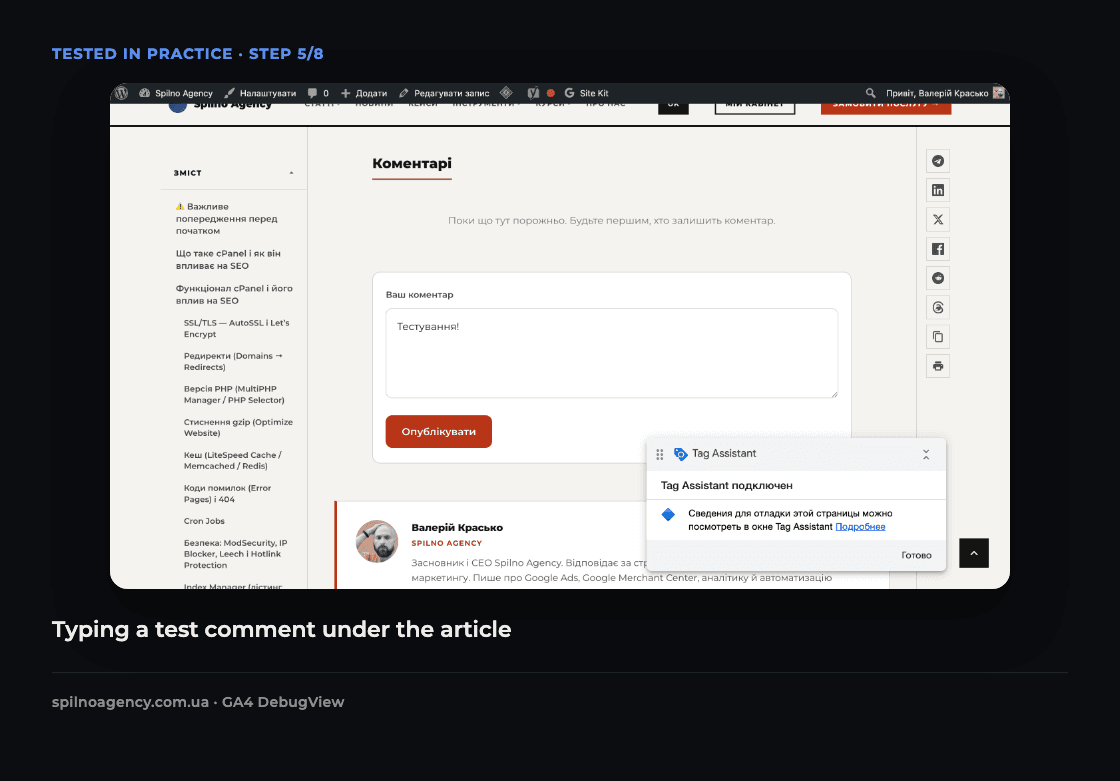
Now for the actual test: we type test text into the comment field under the article and submit it — the exact action whose event we want to verify.
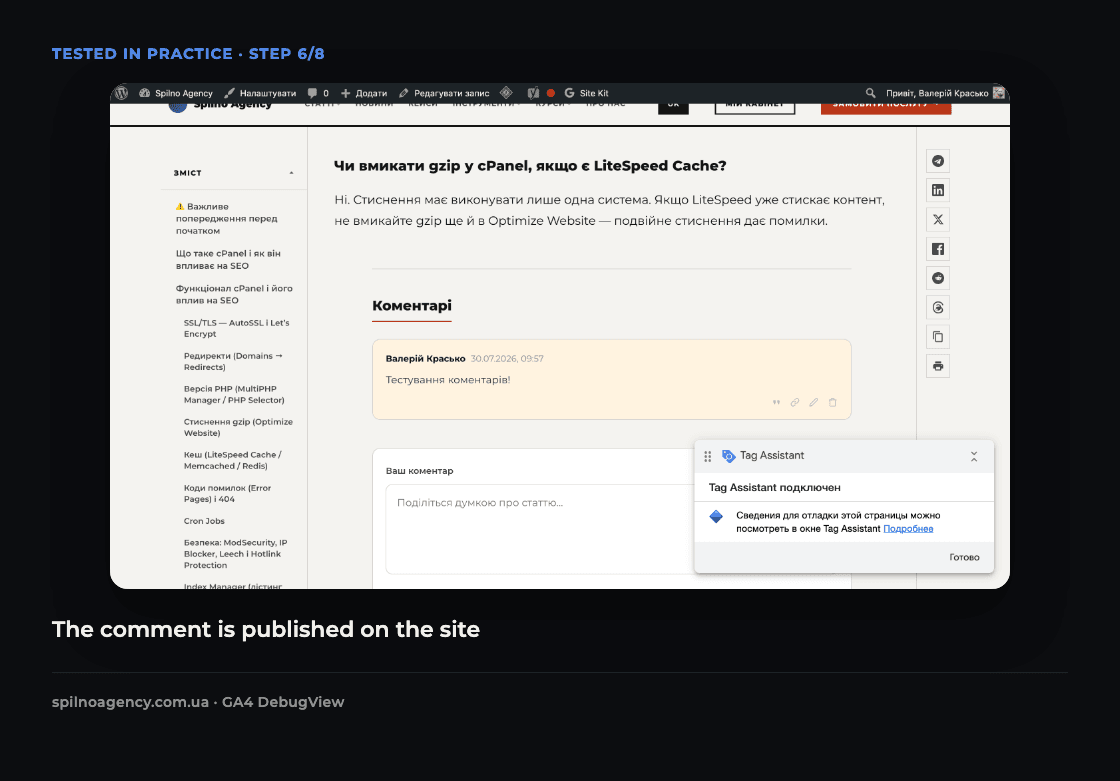
The comment is published successfully and shows up on the page right away. From a visitor’s point of view, the job is done — but what we care about is what just happened on the analytics side.
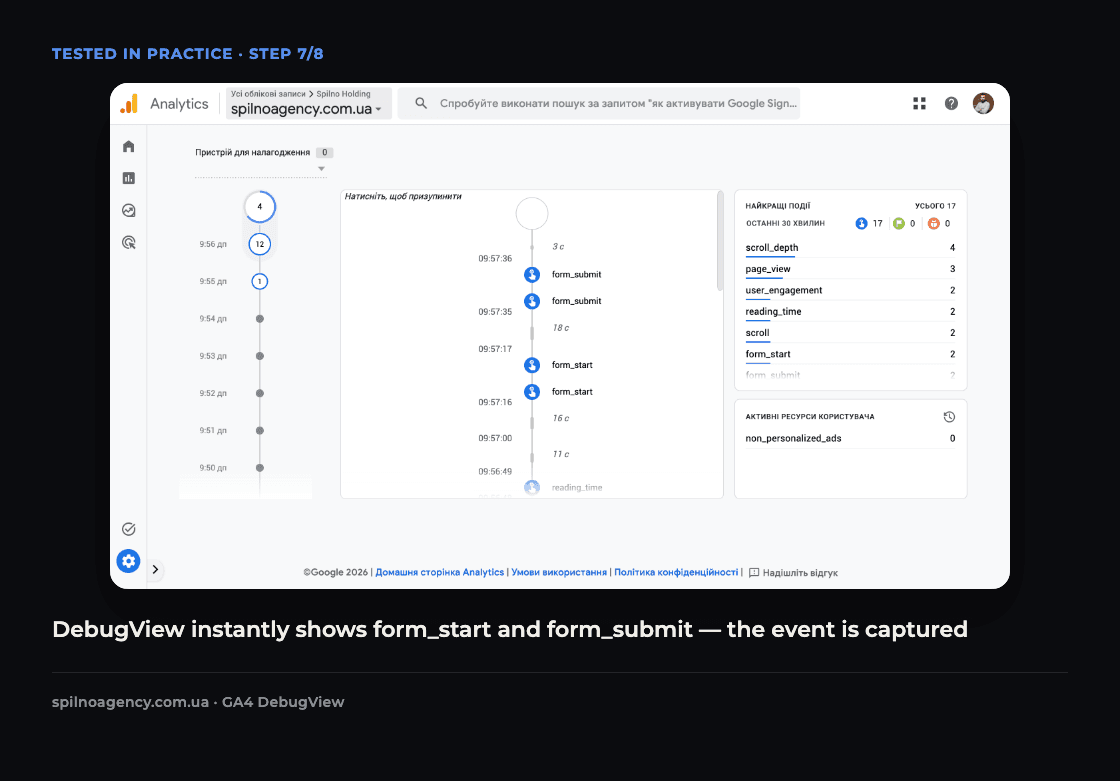
And there’s the answer: right after the comment is published, two new events show up in DebugView — form_start (the moment we started typing into the field) and form_submit (the moment we clicked publish). Both events appear in the chronological feed with a precise timestamp — final proof that the comment-form submission event is being captured correctly by Google Analytics 4.
The key takeaway from this test: when you need to verify a specific action on a site (a form, a comment, a button click), the fastest and most reliable approach is to reproduce that action yourself with debug mode on and watch DebugView live, rather than waiting for the event to “accumulate” in regular reports.
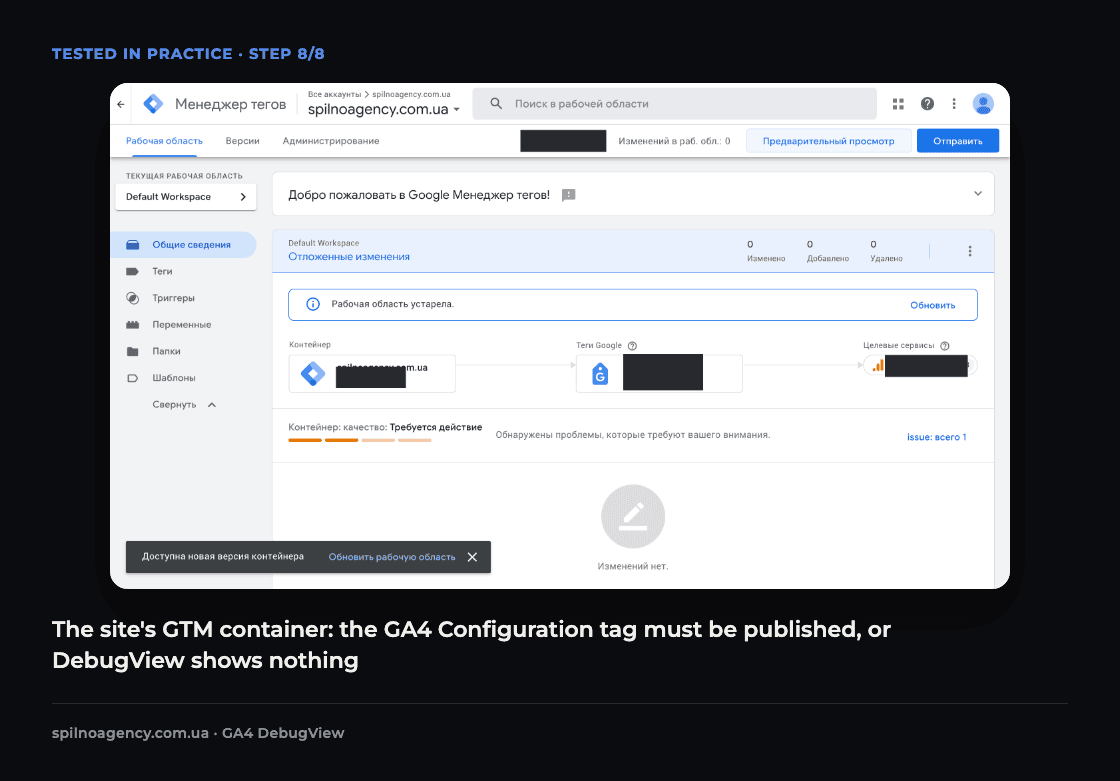
One last, often underrated check: look inside the GTM container itself. This is where the GA4 tag actually reaches the site from — if the container has no published version with a GA4 Configuration tag, DebugView will stay empty no matter what happens on the page.
What DebugView doesn’t show
It’s just as important to understand the tool’s limits. DebugView is a report for verifying one specific event on one specific device, right now — not a replacement for your analytics reports.
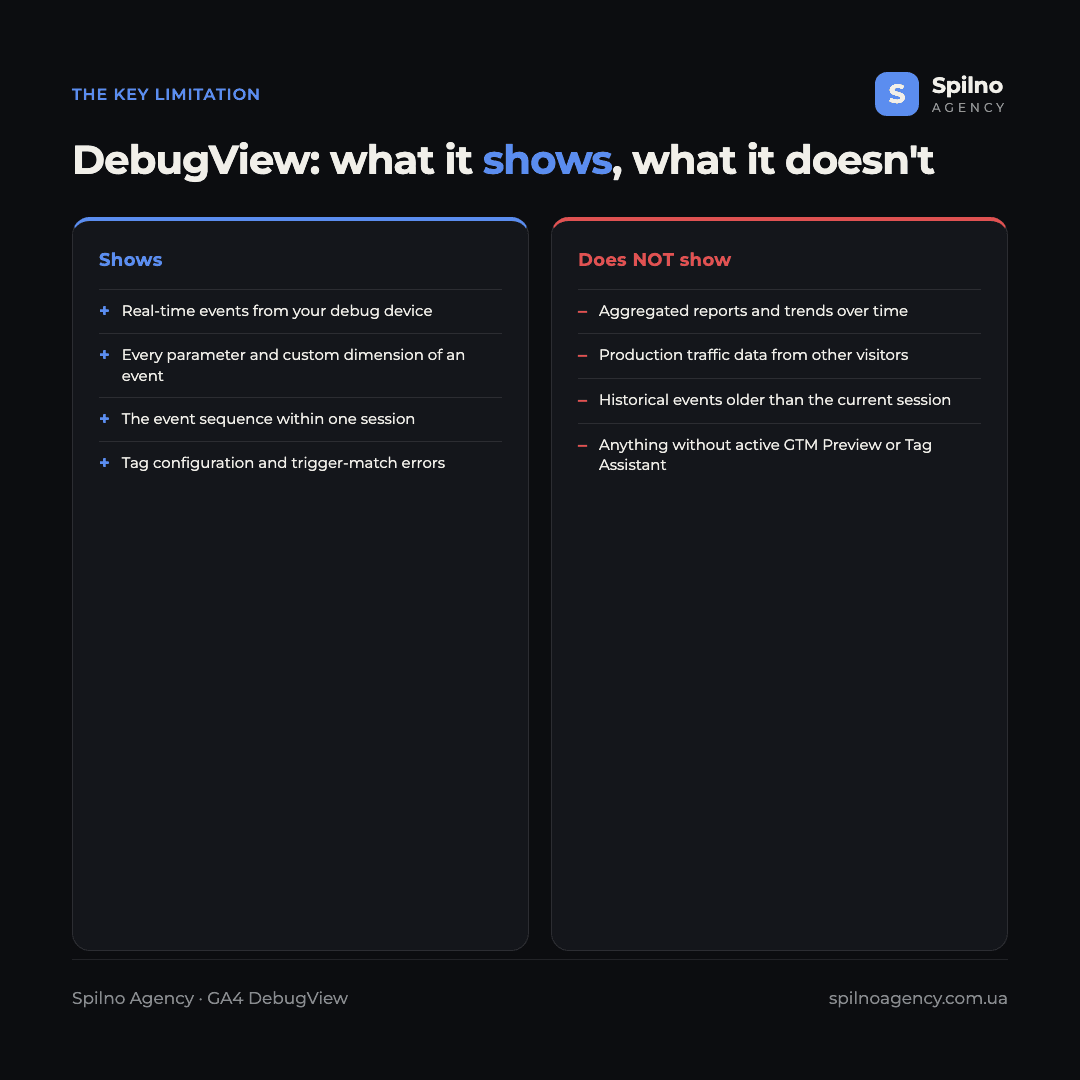
In particular, DebugView will never show the total number of events for a day or a week — that’s what the standard Engagement reports and Explorations are for. It also can’t see traffic from other visitors — only the one device that explicitly turned debug mode on.
Why the event isn’t showing up: common causes
If DebugView is still empty after all the steps above, the problem is almost always one of four things.
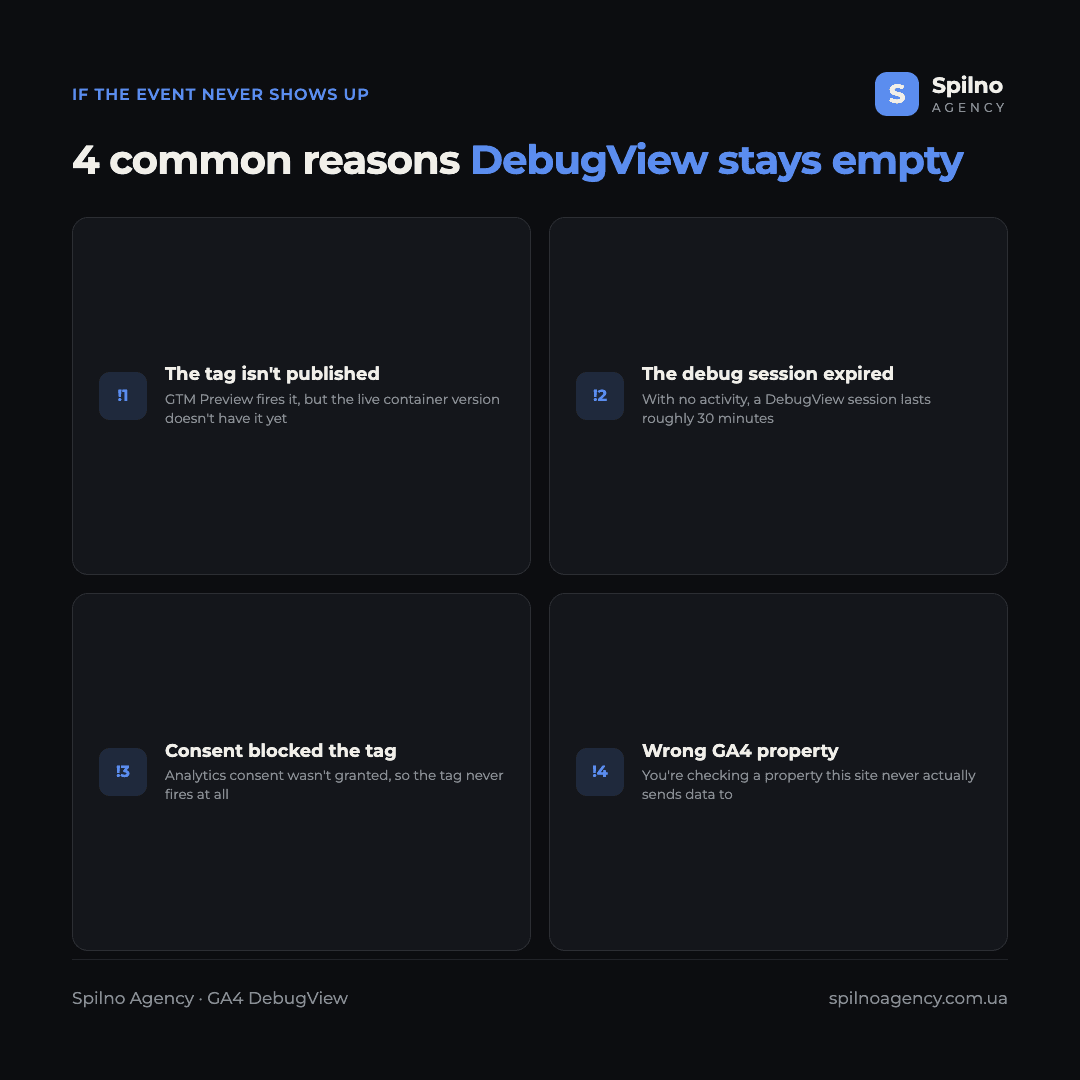
The most common mistake is checking the live site while the tag still only exists in GTM’s Preview mode and hasn’t been published. The second most common: an expired debug session — it lasts roughly 30 minutes without activity, after which DebugView goes back to empty even if the tag itself is configured correctly.
Why this matters for SEO and analytics teams
DebugView saves hours of work where you’d otherwise wait a full day just to learn about a configuration mistake. For agencies and in-house marketers, that means:
- Instant verification of new events. Configure a conversion in GTM and immediately see whether it fires at all, before it ever reaches production.
- Diagnosing issues without a developer. Most event problems are visible right away in DebugView, with no need to dig through the site’s code.
- Confidence before a client report. Before showing a client a conversion dashboard, you can confirm with your own eyes that the data is actually being captured correctly.
If you’re setting up Google Analytics 4 for the first time and haven’t connected tracking to your site yet, start with our guide “How to Install Google Analytics 4” — it covers the base installation through GTM or code, and mentions DebugView as a quick way to verify it. This article is a deeper follow-up focused entirely on DebugView.
How event verification works at Spilno Agency before launching ads
At Spilno Agency, event verification isn’t optional — no ad campaign or SEO project goes live until every key event has been tested and confirmed to fire correctly. The process runs through an event map, DebugView testing, and a dedicated GA4 Ecommerce checklist. We break down the full process, with ready-to-use templates, in “Spilno Agency’s Experience: How We Verify Events Before Starting Work”.
Frequently Asked Questions (FAQ)
What is DebugView in Google Analytics 4?
DebugView is a report in GA4 (Admin → Data display → DebugView) that shows events from a debug device in real time, seconds after they fire, unlike regular reports that come with a 24–48 hour delay.
Why doesn’t DebugView work without Google Tag Manager?
DebugView doesn’t switch anything on by itself — it only shows events from a device in debug mode. The most common way to enable that mode is GTM’s Preview, which automatically adds the debug_mode parameter to GA4 tags for the current session. Without a published or Preview-active GA4 Configuration tag in GTM, events simply have nowhere to go.
How do I enable debug mode without Google Tag Manager?
Two options: install the Google Tag Assistant Chrome extension, which automatically activates debug mode for any site, or, if GA4 is wired up directly through gtag.js, add the debug_mode: true parameter to the gtag('config', ...) call.
Why isn’t my event showing up in DebugView?
Four common causes: the GA4 tag hasn’t been published in GTM yet (it only runs in Preview), the debug session expired (it lasts roughly 30 minutes without activity), analytics consent wasn’t granted, or you’re looking at the wrong GA4 property — one the site never actually sends data to.
How long does a DebugView session last?
A DebugView session automatically ends after roughly 30 minutes of inactivity on the debug device. After that, you need to trigger any action on the site again (like refreshing the page) for data to start flowing in.
How is DebugView different from the Realtime report?
The Realtime report shows aggregated activity across all of the site’s visitors right now — active users, top pages, top events. DebugView, in contrast, shows a detailed chronological feed of events from one specific debug device — with every parameter of every event.
Can regular site visitors tell that DebugView is turned on?
No. Debug mode only flags the one specific device or browser where Tag Assistant or GTM Preview is active. Other visitors have no way of knowing, and it has no effect on the site itself or on GA4’s regular reports.
If you’ve run through this test and still can’t see the event you need in DebugView, or you need conversion tracking set up from scratch, the Spilno Agency team can help verify the link between GA4 and Google Tag Manager and get your analytics fully working.

Read also
Spilno Agency’s Experience: How We Verify Events Before Starting Work
Before launching a campaign in Google Ads or Meta Ads, or starting SEO work, Spilno Agency always checks…

Top Claude Skills for TikTok Ads Specialists (2026)
9 verified Claude skills and MCP servers for TikTok Ads: Pixel/Smart+ audits, Spark Ads hook/hold rate, creator sourcing,…
(data not available) in Google Analytics 4: What This Value Means in 2026
The value (data not available) in Google Analytics 4 reports means that traffic-source information has reached GA4 but…