Cloudflare Web Analytics in 2026: Full Feature Overview vs GA4 and Clarity

Cloudflare Web Analytics is a free web analytics tool with no cookies and no consent banner, built right into the Cloudflare dashboard. By 2026 it has grown from a simple visit counter into a full reporting suite covering Core Web Vitals, load speed, traffic geography, and even custom dashboards that go well beyond classic analytics. This article breaks down every feature using a real example from the spilnoagency.com.ua dashboard, gives an honest comparison with Google Analytics 4 and Microsoft Clarity, and answers the main question: can you already switch to Cloudflare Web Analytics as your primary system, or is it still just a useful add-on?
What is Cloudflare Web Analytics
Cloudflare Web Analytics is a free web analytics service from Cloudflare that collects site visit data without cookies, without fingerprinting, and without a consent banner for personal data processing. The service works on a Real User Monitoring (RUM) model: it collects metrics directly from real visitors’ browsers rather than through synthetic tests. It’s available in the Cloudflare dashboard for any site — both domains already proxied through Cloudflare (the orange cloud) and third-party sites via a separate JS “beacon” script.
The product has existed since 2020, but recent releases have significantly expanded its functionality: a detailed Debug View for each Core Web Vitals metric showing the specific page elements affecting the score, a built-in AI assistant (“Ask AI”) for analyzing data in natural language, and a full custom dashboard builder that combines web analytics with other Cloudflare products (Workers, R2, Queues, Security). By 2026 this is no longer a “checkbox counter” but a standalone performance and traffic monitoring tool.
How it works: privacy-first RUM without cookies
Technically, Cloudflare Web Analytics does not set cookies and does not use any persistent browser identifiers. Instead, visitor uniqueness is computed by the server on the fly from a combination of IP address, User-Agent, and other HTTP request headers, which are then hashed and discarded — no data that identifies a specific person is stored. That’s exactly why the product doesn’t need a GDPR cookie consent banner: it’s legally classified as not processing personal data within the meaning of the cookie directive.
- For sites proxied through Cloudflare (orange cloud) — you can enable automatic script injection with a single click, without touching the site’s code.
- For any other site — Cloudflare provides a small JS snippet (beacon) that needs to be inserted before the closing
</body>tag. - Data updates in real time — the first events can be seen in the dashboard within minutes of installation.
How to set up Cloudflare Web Analytics
- Log in to the Cloudflare dashboard → go to Analytics & Logs → Web Analytics.
- Click Add a site and specify the domain (for domains outside the Cloudflare proxy, the service will provide a JS snippet).
- If the site is already proxied through Cloudflare — enable automatic injection with a single toggle, no code access needed.
- If the site is not on the Cloudflare proxy — insert the provided snippet before
</body>on every page of the site (manually, via a tag manager, or a theme plugin). - Wait a few minutes and check that data is appearing in the Web Analytics section.
Here’s an example of a typical snippet Cloudflare provides for sites outside its own proxy:
<script defer src='https://static.cloudflareinsights.com/beacon.min.js'
  data-cf-beacon='{"token": "YOUR_TOKEN_ID"}'></script>
No extra libraries, backend, or database need to be set up — Cloudflare handles all the data collection and storage itself.
A feature overview from a real dashboard
To show exactly what a site owner sees in the dashboard, we walked through a live Cloudflare Web Analytics account for our own site, spilnoagency.com.ua. Below are real numbers and interface sections covering the last 24 hours and 30 days.
Core Web Vitals: LCP, INP, and CLS in one dashboard
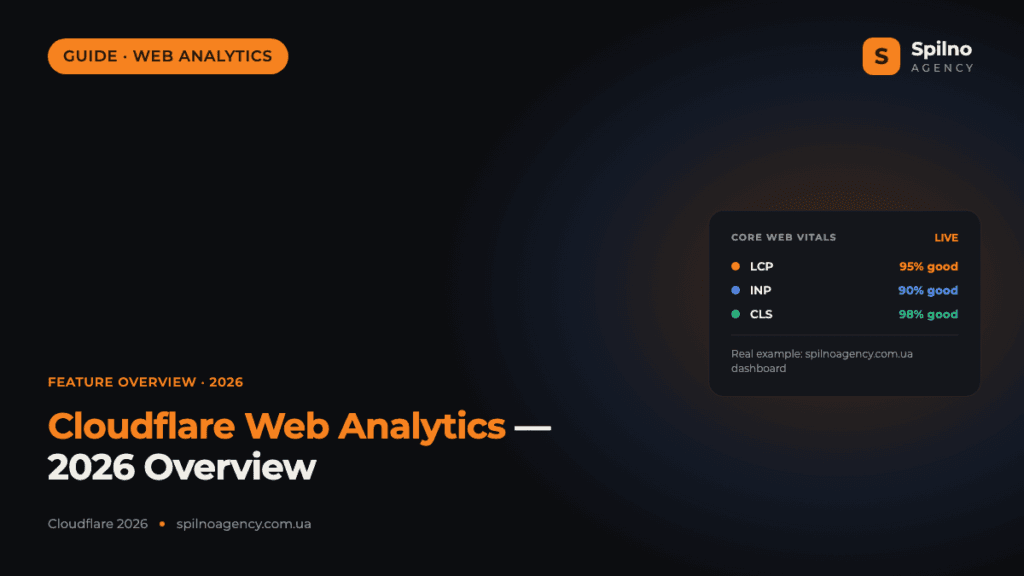
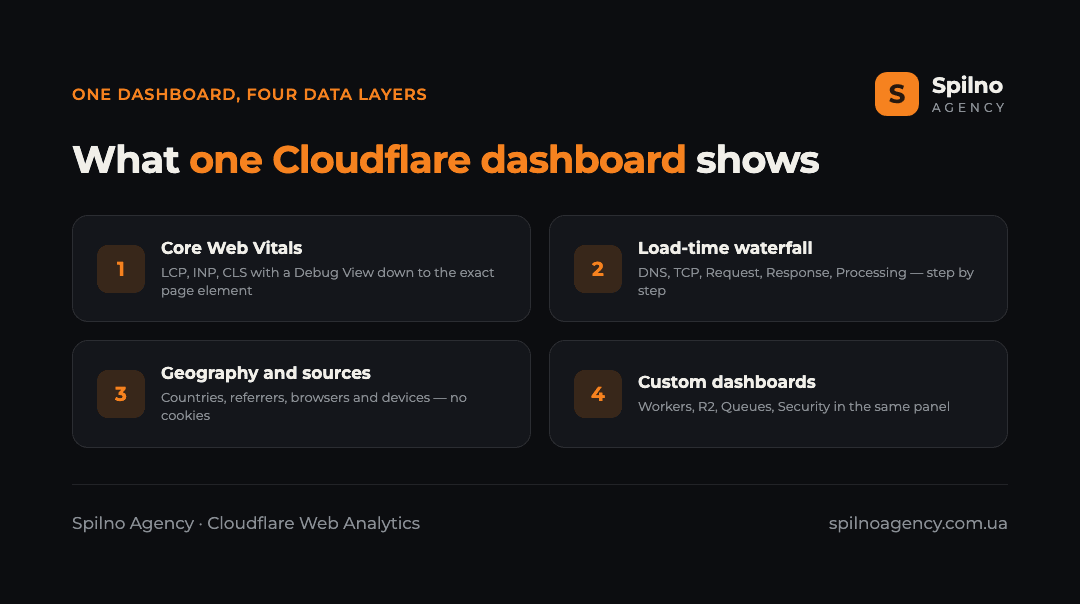
The main Web Analytics screen immediately shows a summary of the three Core Web Vitals metrics — LCP (Largest Contentful Paint), INP (Interaction to Next Paint), and CLS (Cumulative Layout Shift) — each broken down into “Good / Needs Improvement / Poor” using Google’s standard thresholds. In our example, over 24 hours LCP was 95% “Good,” INP was 90% “Good,” and CLS was 98% “Good.” Google uses this same data in Search Console and as a ranking factor, so Cloudflare’s dashboard effectively mirrors what the search engine itself sees.
The most valuable part is the Debug View tab: instead of an abstract percentage, Cloudflare shows the specific HTML element that caused a slow LCP or INP, along with the page URL and how often it occurred. In our example, the dashboard precisely pointed to three article cover images (cover_ua-22-1024x576.png.webp, cover_en-1-768x432.png.webp, cover_ru-100.png.webp) with LCP ranging from 3.3 to 4.5 seconds — a direct, actionable signal to “optimize these specific images,” not just “speed isn’t perfect.” Similarly, for INP the dashboard identified a specific interface element (the article heading h1.art-ttl) with a 1368 ms response delay, and for CLS — an exact block, section.gads-services, with a 0.169 layout shift.
The dashboard also shows LCP percentiles separately — P50, P75, P90, and P99 (in the example: 1044 / 1492 / 1916 / 5196 ms) with a chart over time. This gives you an understanding not just of “average” speed, but of how badly the site loads for the slowest 1–10% of visitors — that “tail” is often exactly what drags down the overall SEO speed score.
Page load time and the page load waterfall
A separate “Page load time” block breaks down total load time into technical stages: DNS, TCP, Request, Response, and Processing. In our example, over 30 days (P75 percentile) total page load was 3494 ms, of which DNS was 0 ms (cached), TCP connection took 617 ms, waiting for the server response took 1438 ms, receiving the response took 309 ms, and browser page processing took 1176 ms. This breakdown immediately shows exactly where the time is “stuck” — in our example, most time goes into waiting for the server response (Request) and browser DOM processing (Processing), not the network portion.
Nearby is a Paint timing report — First Paint and First Contentful Paint (FCP was 804 ms in the example), showing when the user first saw any content on screen rather than a blank page. All these metrics can be filtered by percentile (P50/P75/P90/P99), time period (from 24 hours to 30 days or more), and breakdown — by country, browser, OS, or device type.
Geography, traffic sources, and visitor devices
The Visits and Page views sections give the familiar picture found in any web analytics tool, but without cookies. In the example, over 30 days the site received 9.22 thousand visits and 15.34 thousand page views, broken down across 62–65 countries on an interactive map, top sources (direct, google.com, linkedin.com, and even traffic from chatgpt.com — a sign that visitors are arriving via links generated by AI chatbots), page paths, browsers, operating systems, and device types (desktop/mobile/tablet). Each of these breakdowns can be opened as a separate tab and sorted by volume or by load speed — for example, revealing that mobile devices load the site more slowly than desktop on average (3356 ms versus 4537 ms in the example, depending on the period and sample used elsewhere).
All reports support filters — by default the “Exclude bots equals Yes” filter is enabled, which automatically strips bot traffic from the statistics, and through Add filter you can add your own conditions (for example, a specific path, browser, or country).
Custom dashboards: going beyond web analytics
A separate, very telling part of the product is the Analytics → Dashboards section, where you can build your own dashboards with any combination of charts. In our example, a “Traffic overview” dashboard with 17 charts is already set up. But what’s more interesting: when you click “Create a Dashboard,” Cloudflare offers not just the “Traffic overview” or “Security overview” template, but also Error monitoring, Workers overview, Pages Functions, Durable Objects, Queues, and R2 Storage. This clearly demonstrates the main difference between Cloudflare Web Analytics and GA4 or Clarity: it’s not a standalone web analytics product but one module within the dashboard of a full cloud platform (CDN, Workers, storage, message queues, security), and dashboards can be built simultaneously from site traffic data and from the infrastructure data serving that site.
For a marketer or SEO specialist, this is usually unnecessary complexity — all these Workers/Queues/R2 elements have nothing to do with content marketing. But for a development team or a technical product owner, it’s a unique advantage: there’s no need to piece together data from a separate APM tool and a separate web analytics tool — everything lives in one dashboard.
Cloudflare Web Analytics vs Google Analytics 4
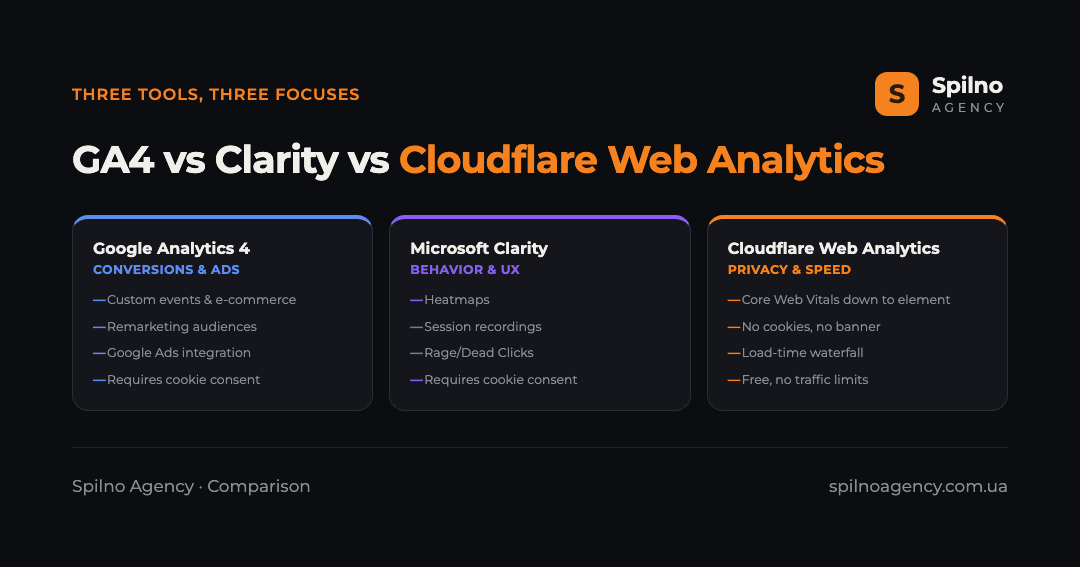
No, Cloudflare Web Analytics doesn’t fully replace Google Analytics 4 yet — it’s a tool for a different job. GA4 is built around an event-based model: custom events, conversions, e-commerce funnels, advertising audiences, integration with Google Ads and BigQuery. Cloudflare Web Analytics doesn’t do this — and doesn’t try to. Instead, it wins where GA4 is consistently weaker: privacy (no cookies, no consent banner, no CLS impact from the banner itself), independence from ad blockers (some adblock lists already block google-analytics.com, while Cloudflare’s script is blocked less often), and depth of Core Web Vitals data — the Debug View with specific page elements is something GA4 doesn’t show at all in its standard configuration.
- Event analytics and conversions — GA4 only: custom events, e-commerce funnels, ad attribution.
- Integration with advertising accounts — GA4 only (Google Ads, Meta via third-party integrations).
- Privacy and user consent — Cloudflare’s advantage: no cookies, no banner, no GDPR/ePrivacy legal burden.
- Accuracy against ad blockers — Cloudflare’s advantage: less likely to end up on adblock extension blocklists.
- Depth of Core Web Vitals data — Cloudflare’s advantage: Debug View with specific page elements out of the box.
- Export to BigQuery, Data Studio, custom reports — GA4 only.
Cloudflare Web Analytics vs Microsoft Clarity
Cloudflare Web Analytics and Microsoft Clarity don’t compete head-on — they cover different types of data. Clarity focuses on qualitative, behavioral analytics: heatmaps, session recordings, Rage Clicks, and Dead Clicks — in other words, it answers the question “what exactly did the user do on the page, and where did they get stuck.” Cloudflare Web Analytics, by contrast, gives a quantitative, performance-focused picture — “how many people visited, from where, and how fast did the page load.” Ideally these two free tools complement rather than replace each other: Clarity answers “why users are leaving,” while Cloudflare Web Analytics answers “is the site fast enough, and where does the traffic actually come from.”
- Heatmaps and session recordings — Clarity only.
- Rage Clicks / Dead Clicks / UX signals — Clarity only.
- Core Web Vitals with element-level detail — Cloudflare’s advantage (Debug View is deeper and more precise than what Clarity shows).
- Technical load waterfall (DNS/TCP/Request/Response) — Cloudflare only.
- Need to install a script — the same for both: a JS snippet; for sites proxied through Cloudflare, setting up Web Analytics is even simpler (no code required).
- Cost — both are free with no traffic limit in the basic version.
Comparison table: three analytics systems
| Criterion | Google Analytics 4 | Microsoft Clarity | Cloudflare Web Analytics |
|---|---|---|---|
| Main focus | Event analytics, conversions, advertising | Behavioral UX analytics (heatmaps, sessions) | Performance (Core Web Vitals) and basic traffic |
| Cookies / consent banner | Required (in most jurisdictions) | Required | Not required |
| Custom events and conversions | Yes, flexible | Limited | None |
| Heatmaps and session recordings | None | Yes | None |
| Debug View for Core Web Vitals | None (aggregated metrics only) | Limited | Yes, down to a specific element |
| Technical waterfall (DNS/TCP/Request) | None | None | Yes |
| Integration with ad accounts | Yes (Google Ads and others) | None | None |
| Export to BigQuery / API | Yes | Limited | Limited (GraphQL Analytics API) |
| Cost | Free (with limits at scale) | Free | Free |
Pros of Cloudflare Web Analytics
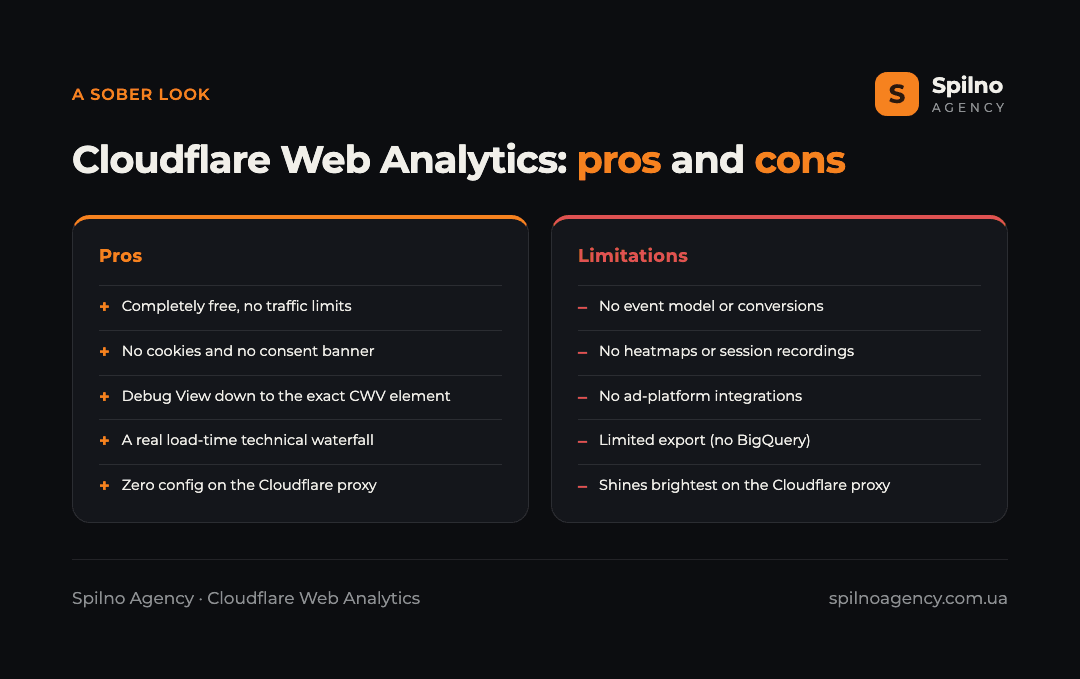
- Completely free, with no limits on event count or traffic volume in the basic version.
- No cookies and no consent banner — removes the GDPR/ePrivacy legal burden and adds no CLS impact from a banner of its own.
- In-depth Debug View for Core Web Vitals — points to a specific page element rather than just a percentage of “poor” visits.
- Technical load waterfall (DNS/TCP/Request/Response/Processing) — rare even among paid tools.
- Zero configuration for sites proxied through Cloudflare — enabled with a single toggle, no code changes needed.
- Not blocked by typical adblock lists as often as classic trackers like Google Analytics.
- Built-in AI assistant (“Ask AI”) for analyzing data in natural language right in the dashboard.
- Lightweight script — beacon.min.js has minimal impact on the site’s own speed.
Cons and limitations of Cloudflare Web Analytics
- No event model or conversions — you can’t build a sales funnel or track a custom event like “added to cart.”
- No integration with ad accounts — data isn’t passed to Google Ads or Meta Ads for campaign optimization.
- No behavioral analytics — no heatmaps, session recordings, or click analysis like Clarity offers.
- Limited audience segmentation — you can’t build cohorts or remarketing audiences like in GA4.
- Tied to the Cloudflare ecosystem — the full feature set (zero configuration, some advanced reports) is best unlocked for sites already proxied through Cloudflare.
- Less flexible data export — no direct integration with BigQuery or Data Studio like GA4 has; only the GraphQL Analytics API is available for custom integrations.
- Limited historical data depth compared to GA4, where you can store and analyze data for years with flexible sampling.
Can Cloudflare Web Analytics replace GA4 or Clarity in 2026
No — and that’s not a shortcoming of the product, but a deliberate choice by Cloudflare not to dilute its focus. GA4 and Clarity solve problems that Cloudflare Web Analytics fundamentally doesn’t touch: event analytics with conversions and ad attribution (GA4), and qualitative UX behavior analysis (Clarity). If a business needs a sales funnel, remarketing audiences, or an understanding of why users abandon a form halfway through — Cloudflare Web Analytics won’t answer those questions.
But within its own focus — private, precise performance and basic traffic analytics with no cookie-related legal burden — Cloudflare Web Analytics in 2026 is no longer a “rough” product but a mature tool that, in terms of Core Web Vitals data depth, outperforms both GA4 and Clarity.
Is it worth using Cloudflare Web Analytics as a second analytics system
Yes, and it’s precisely in that role — a “second, complementary system” — that the product shines brightest. The practical reason is simple: GA4 relies on cookies and JavaScript, so a portion of real visitors (those who decline cookie consent or run an active ad blocker) simply never make it into GA4’s statistics — and that’s not a rare exception, but typically 10–30% of traffic depending on niche and audience. Cloudflare Web Analytics doesn’t depend on cookie consent and is blocked less often by extensions, so it provides an independent, “raw” figure for visits and speed — a kind of sanity check for the numbers coming out of GA4.
- Independent traffic cross-check — if Cloudflare Web Analytics and GA4 numbers diverge significantly, it’s a signal to review consent mode settings or bot filters in GA4.
- Core Web Vitals monitoring for SEO — Debug View with specific elements is more convenient for day-to-day work than Search Console’s field data, which updates with a 28-day delay.
- Backup analytics in case the GA4/GTM tag breaks — since Cloudflare Web Analytics runs at the proxy level or via a separate snippet, it keeps working even if the Google Tag Manager container or GA4 tag on the site breaks.
- Public, cookie-less metrics for pages where a consent banner is unwanted — for example, ad landing pages, where any extra friction lowers conversion.
What Cloudflare Web Analytics focuses on
The product deliberately doesn’t try to be “just another GA4” — the focus is on three things: privacy by default (no cookies, no consent, no cross-site tracking), page performance (Core Web Vitals with element-level detail), and zero cost of ownership (free, with no traffic limit, no separate data hosting to manage). This is analytics for those who need to know “how many, from where, and how fast,” not for those who need a full marketing funnel.
When it makes sense to set up Cloudflare Web Analytics
- The site is already proxied through Cloudflare — setup takes literally one click, so there’s no reason not to do it.
- Visitor privacy matters, or you want to avoid a cookie consent banner on certain pages (landing pages, promo pages).
- You need Core Web Vitals monitoring independent of GA4 for an SEO team or developers, with detail down to a specific page element.
- You have doubts about GA4’s accuracy due to ad blockers or users declining cookies — Cloudflare Web Analytics gives you an independent second reference point.
- Your analytics budget is zero, and you already need basic visit and speed statistics right now.
Frequently asked questions (FAQ)
Is Cloudflare Web Analytics free?
Yes, completely free, with no limits on the number of events or the volume of traffic in the basic version, and it doesn’t require a paid Cloudflare plan.
Does a site need to be proxied through Cloudflare to use it?
No. For sites on the Cloudflare proxy, setup is simplest (a single toggle, no code), but Cloudflare Web Analytics can just as easily be installed on any other site via a separate JS snippet, regardless of where it’s hosted.
Does Cloudflare Web Analytics replace Google Analytics 4?
No. Cloudflare Web Analytics has no event model, conversions, or ad account integration — GA4 is still needed for that. It’s best to use both tools in parallel: GA4 for marketing and conversions, Cloudflare Web Analytics for private, independent verification of traffic and speed.
Do you need a cookie consent banner for Cloudflare Web Analytics?
No. The service doesn’t set cookies and doesn’t store data that identifies a specific visitor, so it doesn’t fall under the consent banner requirement of the ePrivacy/GDPR cookie directive.
How accurate is Cloudflare Web Analytics data compared to GA4?
Both tools can show different numbers — and that’s normal: GA4 loses part of its traffic due to cookie refusals and ad blockers, while Cloudflare Web Analytics is blocked less often but doesn’t build sessions the same way GA4 does. A 10–30% difference between the two systems is typical, not an error in either tool.
Does Cloudflare Web Analytics show Core Web Vitals the same way as Google PageSpeed Insights?
The data is similar in nature (both are based on real-user field data), but Cloudflare Web Analytics collects its own field data directly from site visitors in real time, whereas PageSpeed Insights relies on aggregated Chrome UX Report (CrUX) data for its mobile/desktop reports, with a delay of several weeks.
Can you export data from Cloudflare Web Analytics?
Yes, the GraphQL Analytics API lets you export raw data for your own reports or integrations, although there’s no ready-made connector to BigQuery or Google Data Studio like GA4 has.
Who is Cloudflare Web Analytics best suited for?
Owners of sites on Cloudflare, developers, and SEO specialists who need fast, free, and private monitoring of speed and basic traffic without deploying a separate analytics system — especially as a complement to GA4 or Microsoft Clarity, not as their full replacement.
Conclusion
In 2026, Cloudflare Web Analytics is no longer a minimalist visit counter but a mature performance monitoring tool with a unique focus on privacy and Core Web Vitals, more detailed than many paid solutions. It doesn’t try to compete head-on with Google Analytics 4 or Microsoft Clarity — and it shouldn’t: each of the three tools has its own focus, and the best results come from combining them. If you need help setting up web analytics, building a full funnel in GA4, or integrating several analytics systems into unified reporting — the Spilno Agency team is ready to step in at any stage.

Read also

Meta Ads Library: How to Find Your Competitors’ Facebook & Instagram Ads (2026)
How to use the Meta Ads Library to see any competitor's Facebook, Instagram and Threads ads for free…

New Features in the ChatGPT Ads Manager: A Step-by-Step Setup Guide
oCPC for product feeds, URL macros, pixel diagnostics, Triple Whale and Hightouch, AAM from 17 August 2026. A…

How to See Your Competitors’ Ads in Google Ads (2026 Guide)
Step by step: find competitor ads in the Google Ads Transparency Center — filters, ad detail cards, archive…