How to Analyze Hourly Statistics in Google Analytics 4

Google Analytics 4 has no dedicated “hourly statistics” menu item, but you can get that exact breakdown in 3 clicks — by adding the “Hour” dimension as a secondary dimension to any table-based report. This reveals what time of day your site gets the most traffic, calls, leads, or purchases — and lets you use that data to schedule ads, staff live chat, or time newsletters. This guide walks through it step by step, with screenshots, when it’s actually worth doing, and what to watch out for when reading the data.
What hourly analysis in GA4 is and why it matters
Standard GA4 reports (Reports snapshot, Acquisition, Engagement) show data broken down by day, week, or month by default. That’s fine for spotting general trends, but it doesn’t answer a very practical question: “what time of day do most of the valuable actions on my site actually happen?”
GA4 stores the timestamp of every event down to the second, and the “Hour” (hour) dimension is available in any of the standard GA4 reports as a secondary dimension, or in Explore. Adding it splits any metric — users, sessions, conversions, calls — into 24 rows, one per hour of the day. That’s what “hourly analysis” really is: not a separate report, but a way of drilling into data you already have.
How to build a GA4 report with an hourly breakdown, step by step
We’ll walk through the Acquisition → User acquisition report as an example — but the same method works in any GA4 report that has a table with rows.
Step 1. Open a report that has a data table
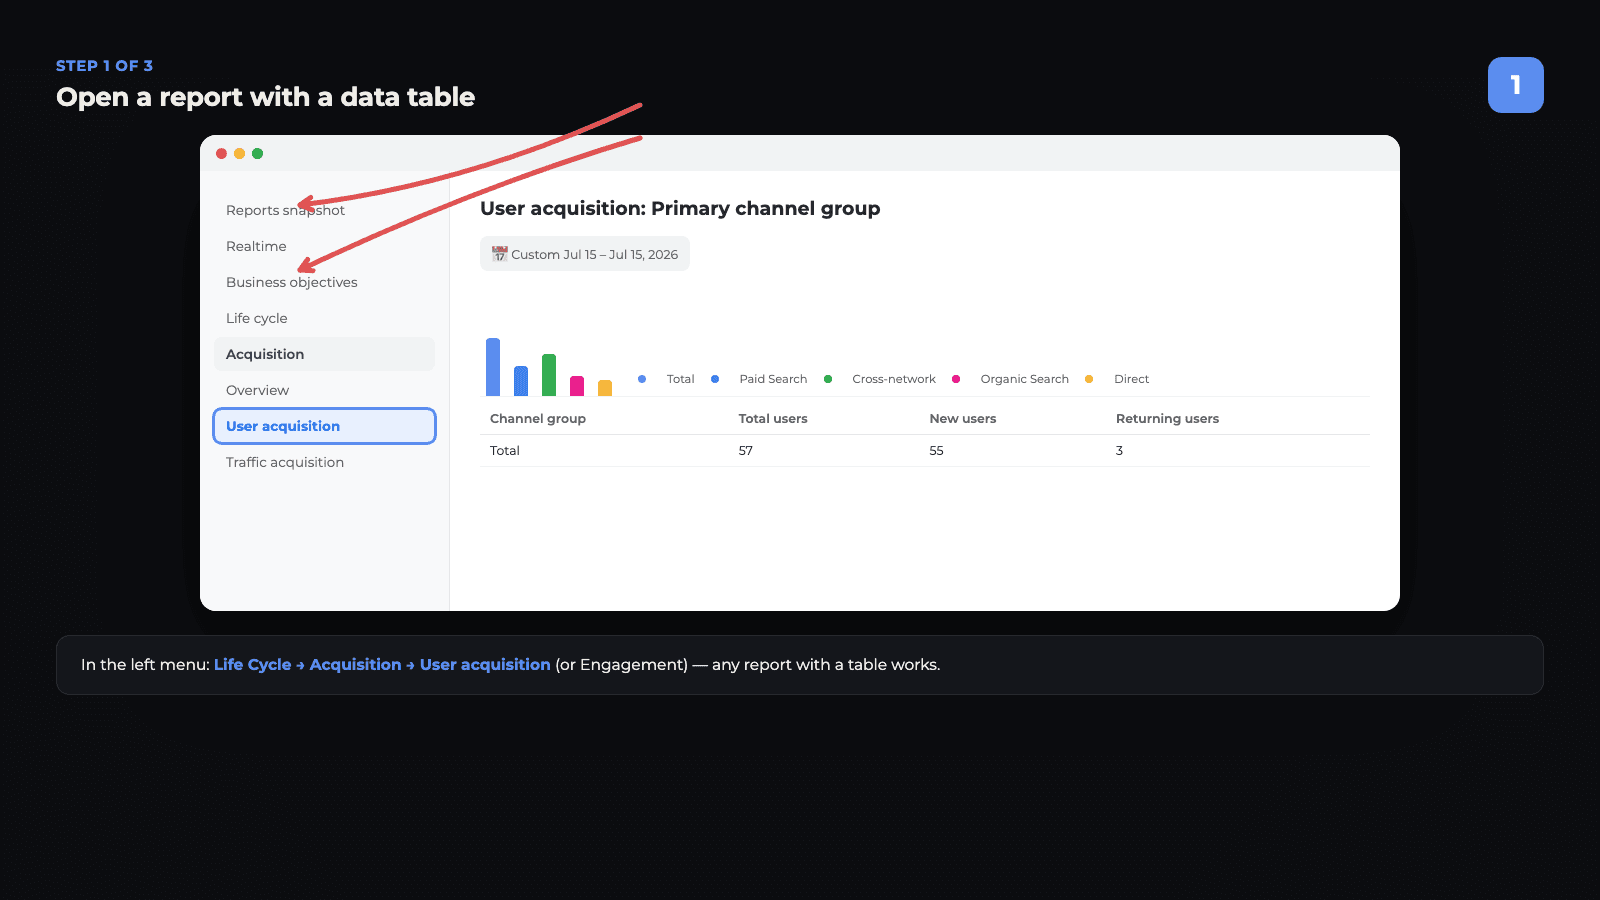
In the left-hand menu, go to Life cycle → Acquisition → User acquisition (or any other table-based report — Engagement overview, Traffic acquisition, Lead generation, and so on). Make sure to set the date range you need in the top right corner first — by default GA4 shows totals for the whole selected period, with no hourly breakdown until you add one.
Step 2. Add the “Hour” dimension
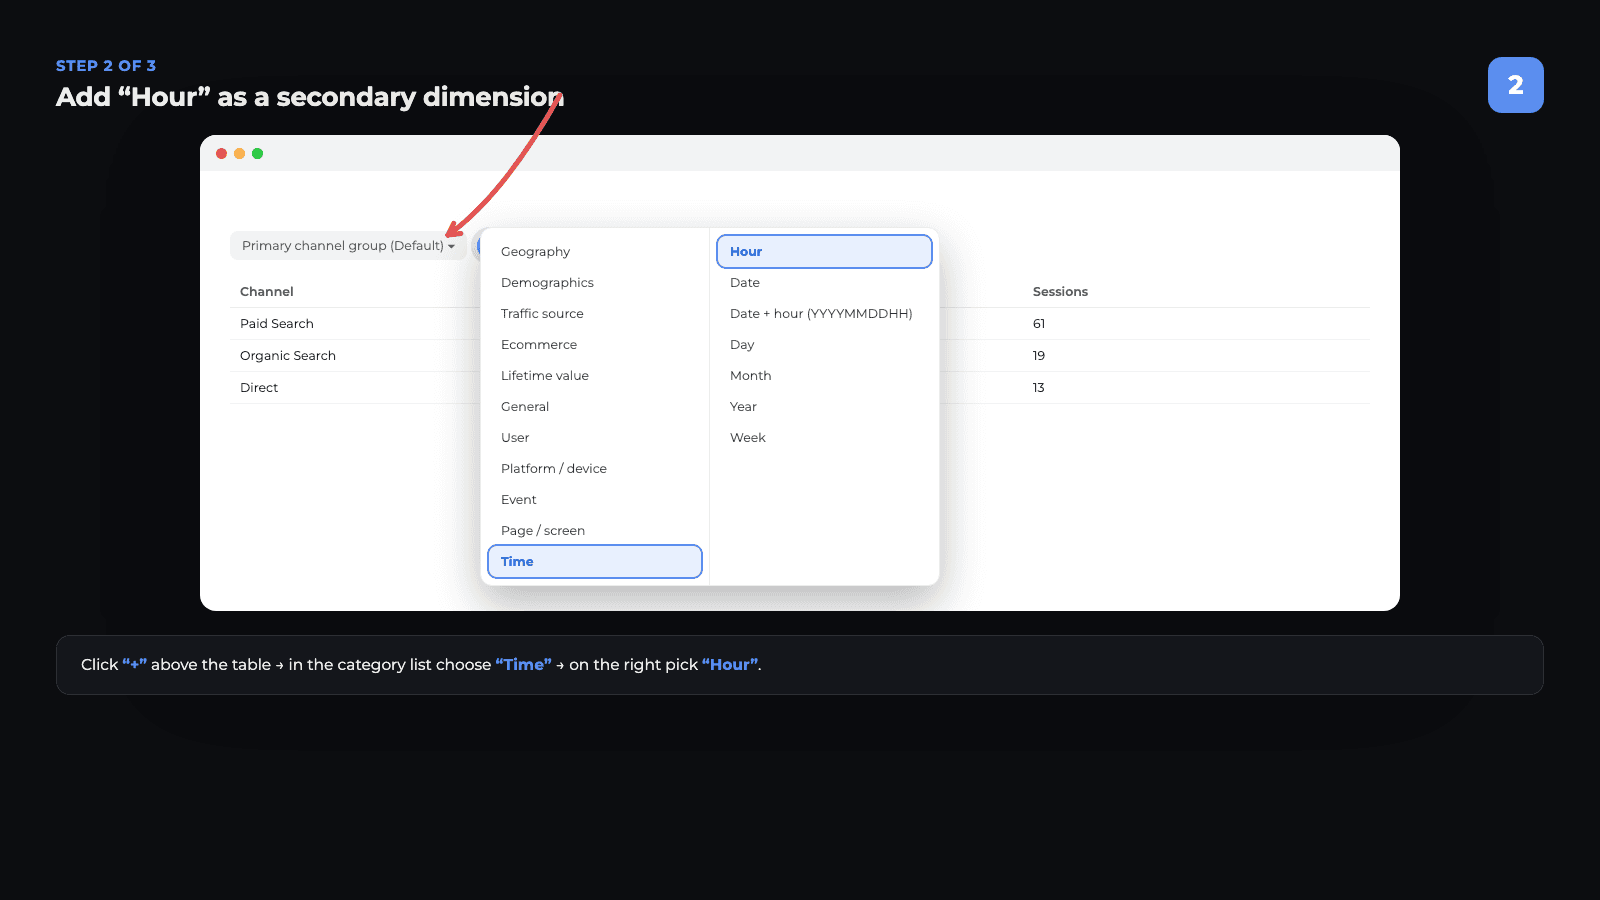
Above the table, next to the name of the current dimension (for example, “Primary channel group”), click the “+” icon. A list of dimension categories opens — choose the “Time” category, then “Hour”. GA4 immediately rebuilds the table: every channel-group row now splits into sub-rows by hour (0–23).
Tip: if you care about one specific action (a call, a lead form, a purchase), pick that event from the “Key events” dropdown above the table first — that way the “Key events” column shows just that action, not the sum of every event.
Step 3. Read the result
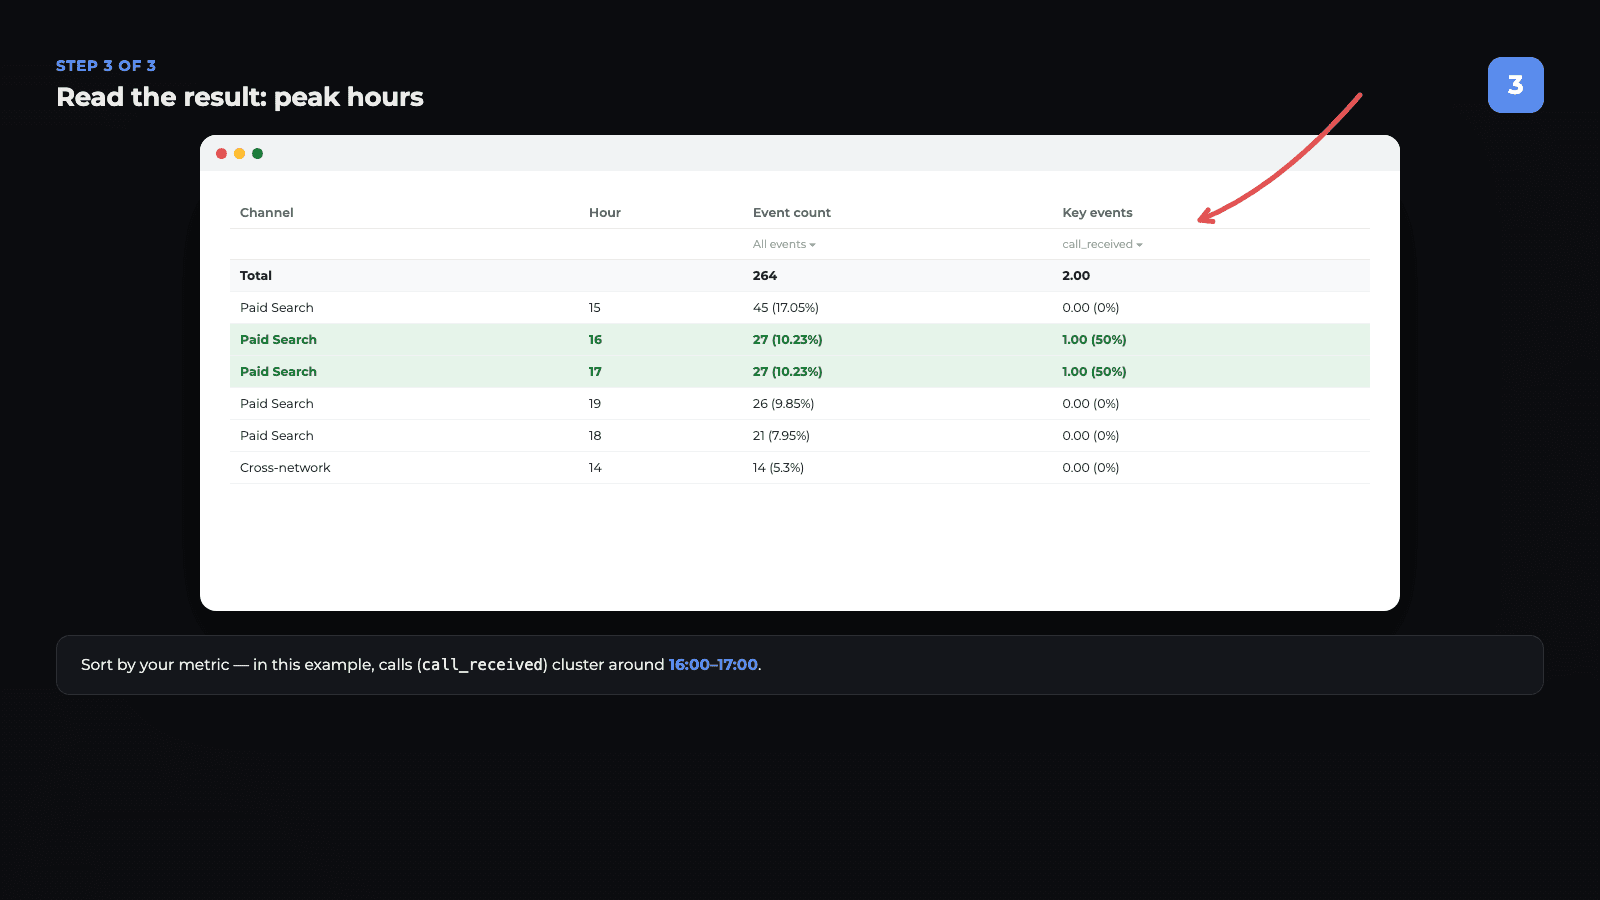
The table now has an extra “Hour” column (values 0–23) and shows metrics for every combination of “channel + hour”. Sort by the metric you care about (for example, “Key events”) to spot the hourly peaks right away. In a real example, calls coming from paid traffic — tracked through a call-tracking event (e.g. from a service like CallRail or Ringostat) — turned out to cluster tightly between 4pm and 5pm. That’s exactly the kind of insight this breakdown is built for.
An alternative route is Explore, where you can build a free-form table or chart using the “Hour” dimension without the limits of a standard report, or compare several metrics and segments by hour on a single chart.
When hourly analysis is actually worth it: 6 scenarios
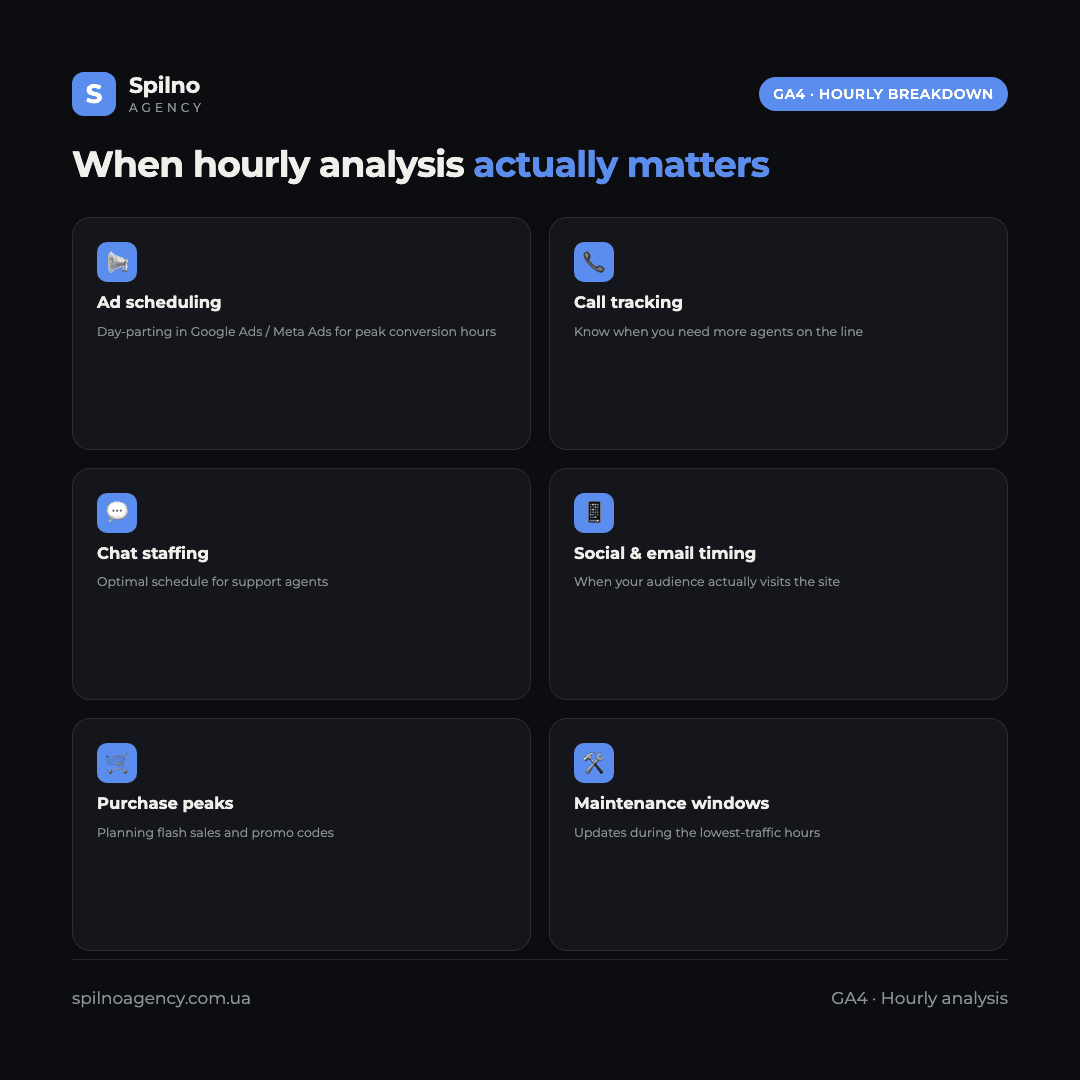
An hourly breakdown isn’t “data for data’s sake.” Here are concrete situations where it directly shapes a decision:
- Ad scheduling (day-parting). Both Google Ads and Meta Ads let you pause delivery during “dead” hours and raise bids during peak ones. A GA4 hourly report shows when traffic actually converts best — not just when there’s the most of it.
- Call tracking and call-centre load. If you have a call-tracking service connected (e.g. CallRail, Ringostat) and call events flow into GA4, an hourly breakdown of that event shows exactly when you need more agents on the line — and when you can safely scale a shift down.
- Live-chat and support staffing. The same logic applies to chat: an hourly breakdown of the “chat opened” or “message sent” event tells you the optimal schedule for chat agents.
- Timing for social posts and email campaigns. The hourly distribution of sessions from the “social” or “email” channel shows when your audience actually visits after a post or a newsletter goes out — instead of relying on generic “post at 6pm” advice.
- E-commerce: peak purchase hours. An hourly breakdown of the
purchaseevent helps plan flash sales, promo-code launch times, and order-support staffing around the hours when buying activity actually peaks. - Technical diagnostics and maintenance windows. Knowing the hours with the lowest traffic lets you schedule updates, deployments, and maintenance work to affect the fewest possible users.
How to read hourly data correctly: 4 things to check
- Time zone. The hours shown in GA4 reports follow the time zone set in the property configuration (Admin → Property Settings → Reporting time zone) — not the time zone of the browser viewing the report. Check which time zone is set before drawing any conclusions.
- One day is not enough. An hourly distribution from a single day can easily be a random outlier. For a reliable read, analyse at least 2–4 weeks and check whether the same peak repeats at the same hour day after day.
- Data thresholding and low volume. On lower-traffic sites, splitting data into 24 hourly buckets sharply reduces the number of events in each row — some rows can collapse into “(other)” because of GA4’s privacy thresholds, or simply become too small a sample to draw conclusions from.
- Weekdays vs weekends. Hourly patterns on weekdays often look very different from weekends. If you need precision, add the “Day of week” dimension as well, or analyse weekdays and weekends separately.
Common mistakes in hourly analysis
- Confusing the Realtime report with an hourly breakdown. The “Realtime overview” report only shows activity from roughly the last 30 minutes and doesn’t retain hourly history — it’s not suitable for analysing patterns over weeks or months. For that, you need the “Hour” dimension in standard reports or in Explore.
- Not checking the property’s time zone — leading to conclusions that are shifted by several hours from reality.
- Analysing a single day instead of a multi-week trend and making decisions based on a random spike.
- Forgetting to pick a specific event in “Key events” — which leaves the column showing the sum of every event instead of the one action (a call, a purchase) you actually care about.
Conclusion
Hourly analysis in GA4 isn’t a separate report — it’s the “Hour” dimension, added as a secondary dimension to any table, or built inside Explore. It turns generic traffic statistics into a practical tool: when to run ads, when to reinforce your call centre or chat support, when to publish content, and when to schedule maintenance. The key is to look at a period of several weeks, check the property’s time zone, and avoid drawing conclusions from too small a sample.
If you need help setting up GA4, building dashboards around specific business questions, or an analytics audit of your advertising, the Spilno Agency team is ready to help — for European businesses running campaigns across Google Ads and Meta Ads alike.
Frequently asked questions about GA4 hourly analysis
Does Google Analytics 4 have a dedicated “hourly” report?
There’s no dedicated menu item. There is an “Hour” dimension that can be added as a secondary dimension to any standard table-based report, or built inside the Explore section.
How do I add the “Hour” dimension to a GA4 report?
Click “+” next to the dimension name above the table, choose the “Time” category → “Hour”. The table splits every row into sub-rows by hour of day.
Which time zone are the hours shown in GA4 based on?
The time zone set in the property configuration (Admin → Property Settings), not the browser’s time zone. Always check this setting before drawing conclusions.
Can I filter hourly data by a specific event?
Yes — select the event you need from the “Key events” dropdown above the table, and the hourly data will reflect just that event, not the total of every event.
How many days of data do I need for a reliable analysis?
At least 2–4 weeks — only a peak that repeats at the same hour day after day should be treated as a stable pattern.

Read also
Google Tag Manager Workspaces: Why You Need Them and How to Use Them in 2026
A workspace in Google Tag Manager is a “draft” of a container — a place to safely edit…
How to Track Revenue, Transactions and Purchases in Google Analytics 4 from WordPress WooCommerce
Introduction WooCommerce store owners are often convinced that Google Analytics 4 already shows them revenue, transaction counts and…

cPanel SEO: How to Optimize Your Hosting for Search in 2026 (Enable & Disable)
cPanel is a hosting control panel that packs dozens of features with a direct impact on SEO: HTTPS…