Google Ads Rules: Maximum Lead Price, Customer Price, and How Much to Spend Before a Campaign Fails

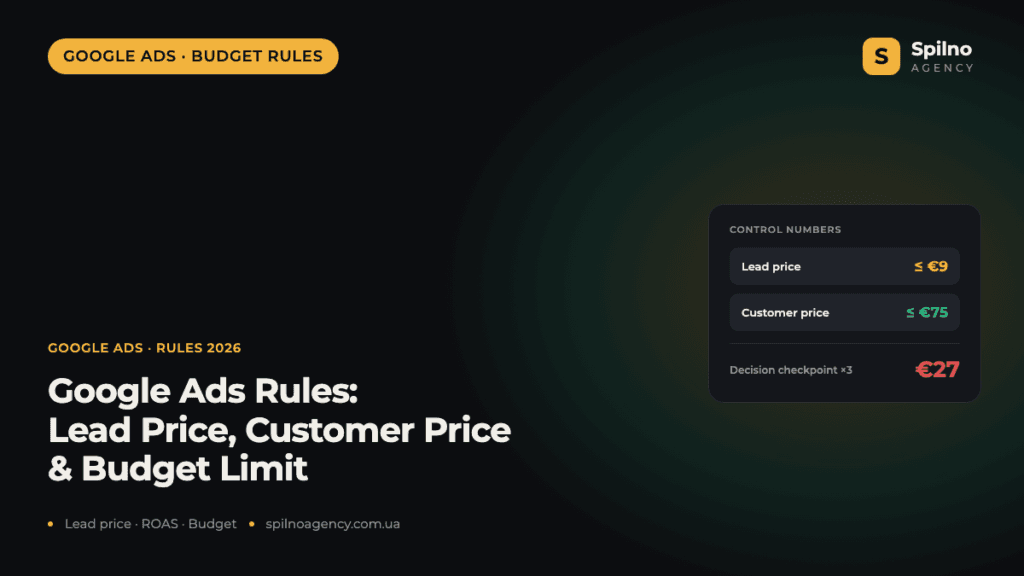
There is no such thing as a universal “good cost per lead” — €20 per lead can be a profit or a loss depending on your average order value and margin. This is Spilno Agency’s methodology: how to calculate your maximum lead price, your maximum customer price, and how much you can spend on a Google Ads campaign before honestly concluding it isn’t working.
Why “a good cost per lead” is a myth without context
“What’s a normal cost per lead on Google Ads?” is one of the most common questions European business owners ask. The problem is that there’s no single answer. A €50 cost per lead can be profitable for a furniture retailer with a €1,500 average order and disastrous for an accessories store with a €30 average order.
Without tying the number to average order value, margin, and lead-to-customer conversion rate, any “good cost per lead” figure is a guess. That’s why at Spilno Agency, before launching any campaign, we don’t calculate “how much we’d like to pay per lead” — we calculate the maximum allowable price, above which the campaign mathematically cannot break even.
Three control numbers that set the rules of the game
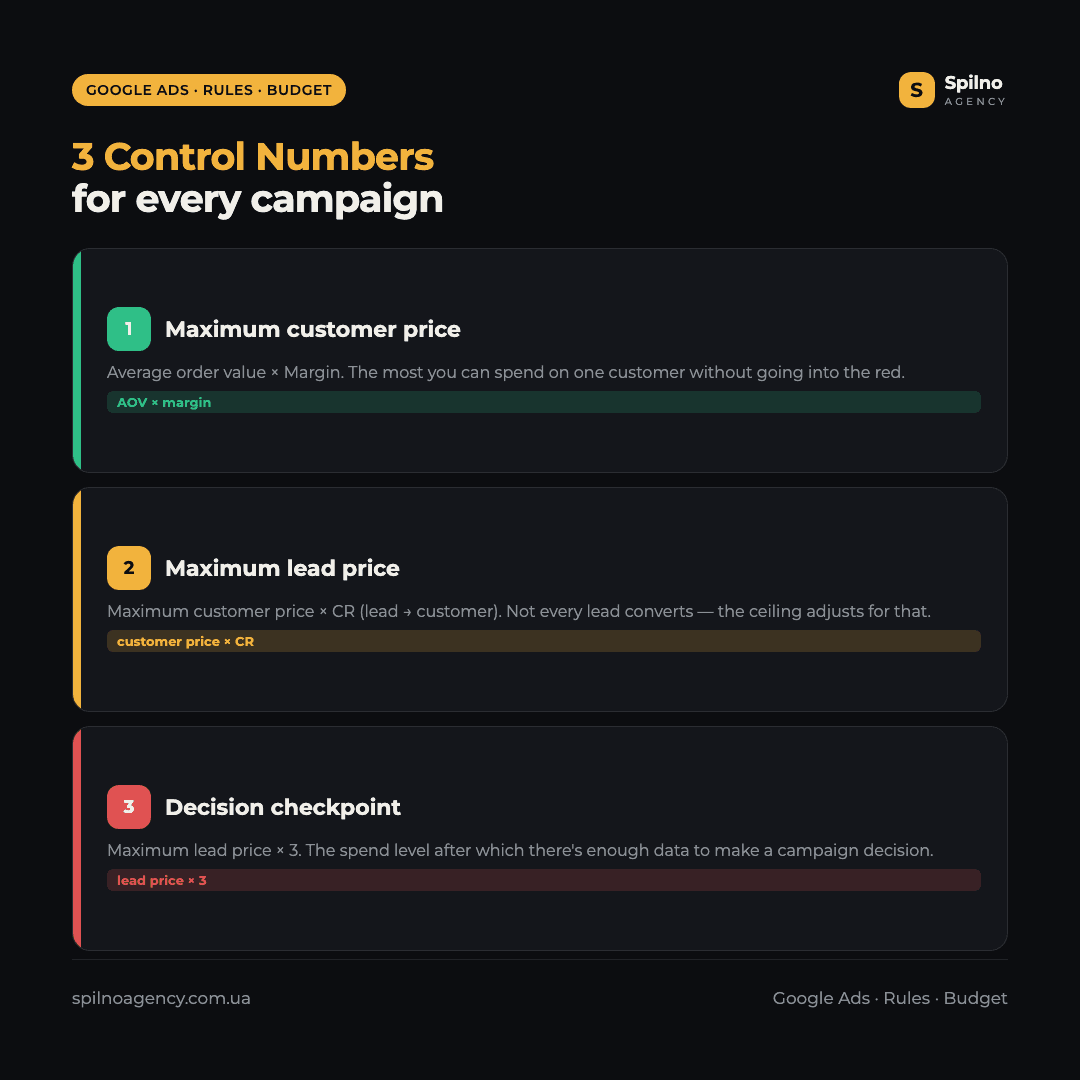
Before launching a campaign — and especially before optimising or pausing one — you need three numbers. Together they define the “rules” of the campaign: the boundaries within which ad spend works for the business, not against it.
- Maximum customer price — the most you can spend acquiring one customer without going into the red.
- Maximum lead price — the most you can pay for one lead, accounting for the fact that not every lead becomes a customer.
- Breakeven ROAS — the minimum revenue-to-spend ratio below which the campaign operates at a loss.
Maximum customer price — formula and example
The formula is simple:
Maximum customer price = Average order value × Margin
Example: an online store with an average order value of €250 and a margin of 30%. Maximum customer price = €250 × 0.30 = €75. This is the ceiling: if acquiring one customer through Google Ads costs more than €75, the campaign is running at a loss — even if the report shows a great CTR and a low cost per click.
Maximum lead price — formula and example
Not every lead becomes a customer, so the maximum lead price is derived using the lead-to-customer conversion rate:
Maximum lead price = Maximum customer price × CR (lead → customer)
Continuing the example: if the lead-to-customer conversion rate is 12%, maximum lead price = €75 × 0.12 = €9. It’s the same ceiling, one level up: paying more than €9 per lead bakes in a loss upfront, even if some of those leads eventually convert.
Both numbers are calculated before the campaign launches — at the brief or strategy stage. These are the “rules” against which every campaign, ad group, and even individual keyword is later evaluated.
The full calculation funnel: where the control numbers actually come from
The two formulas above are a shortcut to the control numbers. It’s worth seeing the full funnel they come from. Below is the same calculation from the internal campaign-economics model we use at Spilno Agency (demo figures in Ukrainian hryvnia (UAH) — this is Spilno’s own real reference model, kept in its original currency; margin is taken as 100% to keep the example simple — plug in your own business’s real margin and currency).
Account level. The model starts with budget and cost per 1,000 impressions (CPM) — relevant for Google Ads’ impression-based formats: YouTube, Demand Gen, Display. If a campaign runs on CPC instead (typical for Search), this block is simply skipped — plug in your actual cost per click and move to the next level.
| Metric | Formula | Value |
|---|---|---|
| Budget | input | 67,070 UAH |
| CPM (cost per 1,000 impressions) | input | 197 UAH |
| Impressions | Budget ÷ CPM × 1,000 | 340,457 |
| CTR | input (account history) | 1.50% |
| Clicks | Impressions × CTR | 5,107 |
| CPC (actual) | Budget ÷ Clicks | 13.13 UAH |
Lead level. Clicks convert into leads through site conversion rate. This produces the actual lead price — not yet the control price, just “what the lead actually cost in this campaign.”
| Metric | Formula | Value |
|---|---|---|
| CR click → lead | input (site conversion rate) | 5% |
| Leads | Clicks × CR | 255 |
| Actual lead price | Budget ÷ Leads | 263 UAH |
Customer level. Not every lead buys — sales-team conversion (CRM) kicks in here, producing the actual customer price.
| Metric | Formula | Value |
|---|---|---|
| CR lead → customer | input (sales-team conversion) | 10% |
| Customers | Leads × CR | 26 |
| Actual customer price | Budget ÷ Customers | 2,627 UAH |
Profitability level. This is where fact meets business economics: average order value and margin turn a customer count into revenue and profit. This is where it becomes clear whether the campaign makes sense at all.
| Metric | Formula | Value |
|---|---|---|
| Average order value | input | 2,683 UAH |
| Margin | input | 100% |
| Revenue | Customers × AOV | 68,503 UAH |
| ROAS | Revenue ÷ Budget | 1.02 |
| ROI / ROMI | Profit ÷ Budget | 102.1% |
| Profit from total budget | Revenue × Margin | 68,503 UAH |
| Profit per customer | Profit ÷ Customers | 2,683 UAH |
In this example margin is set to 100% (a simplification for the demo model), so ROI/ROMI numerically matches ROAS — profit equals revenue. In a real business with, say, 30% margin, profit would be a third of revenue, and ROI/ROMI would be calculated on profit, not on total revenue.
The key takeaway from this funnel: control numbers are calculated not from budget, but from revenue — how much the business actually earned, not spent. That’s why:
| Control metric | Formula | Value |
|---|---|---|
| Maximum lead price | Revenue ÷ Leads (= AOV × margin × CR lead→customer) | 268 UAH |
| Maximum customer price | Revenue ÷ Customers (= AOV × margin) | 2,683 UAH |
| Breakeven ROAS | the breakeven threshold | 1.00 |
| 3x checkpoint (the 3x rule) | Maximum lead price × 3 | 805 UAH |
Notice that the maximum lead price (268 UAH) is slightly higher than the actual one (263 UAH) — exactly by the margin ROAS sets. That’s not a rounding artefact, it’s the model’s logic: the control number is always calculated “from revenue,” the actual one “from spend.” As long as the control number stays above the actual one, the campaign is in the black; once the actual lead or customer price crosses the control ceiling, the campaign is already running at a loss — even if conversions keep coming in.
The 3x rule: how much to spend on a campaign before calling it a failure
This is the question that most often goes unanswered — and it’s exactly where specialists waste the most client budget. Pausing a campaign after the first €30 with zero leads is just as much a mistake as keeping a loss-making campaign live for months “because it’s still too early to tell.”
At Spilno Agency we use a simple rule — the 3x rule:
Decision checkpoint = Maximum lead price × 3
In our example: €9 × 3 = €27. That’s the spend on a campaign, ad group, or keyword after which there’s finally enough signal in the data to make an informed decision — instead of guessing.
Why 3x, not 1x or 10x. A single “maximum lead price” cycle isn’t enough — even a profitable campaign can randomly miss a lead on its first clicks; that’s statistical noise, not a problem signal. Ten cycles is too expensive a check — by the time you draw a conclusion, the client will have lost far more budget than the decision was worth. Three cycles is the practical balance: enough data to tell “the campaign got unlucky at the start” apart from “the campaign mathematically can’t break even.”
Important: if a campaign has spent an amount close to a single maximum lead price in its first few days without a conversion, that’s not yet a reason to panic. But spend above that amount without a single lead at an acceptable price already meaningfully lowers the odds of the campaign turning profitable — so every euro beyond the threshold should be spent deliberately, not on autopilot.

What to do once a campaign crosses the control checkpoint
Reaching the checkpoint isn’t a “pause it” command. It’s a command to “look at the data and make one of three decisions”:
- Scale. Actual lead/customer price is below the maximum, and conversions are coming in steadily. Increase budget gradually — 15–20% at a time, re-checking a few days later.
- Optimise. There are clicks and impressions, but few conversions, or they’re close to the ceiling. Review the highest-spending keywords with no conversions, negative keywords, ad-to-query relevance, and the landing page. Give the campaign one more 3x cycle after the changes.
- Pause or reallocate budget. Spend has already exceeded the checkpoint several times over, conversions are absent or well above the ceiling, and optimisation from the previous step didn’t help. At this point it’s more rational to redirect budget to campaigns that are already profitable.
Test campaigns are a separate case. If a client is deliberately testing a new audience, product category, or ad format, a share of budget outside the breakeven rules is normal practice — provided it’s capped and documented in advance (e.g. 10–15% of total budget), not discovered after the fact in a report.
Common mistakes when setting budget limits
We regularly see these mistakes when auditing accounts of clients coming from other agencies:
- The limit is set on CPC or CTR instead of lead or customer price. A cheap click guarantees nothing — site conversion rate and traffic quality matter far more than the cost of the click.
- Control numbers aren’t calculated before launch. The “pause or not” decision gets made emotionally, based on a feeling that “sales are taking too long,” rather than a formula.
- No separate limit for test campaigns. A test without a predefined budget cap isn’t a test — it’s uncontrolled spend.
- Conclusions are drawn on too small a sample. Pausing a campaign after 2–3 clicks with no lead is a classic beginner mistake — there isn’t enough data yet to conclude anything.
- Margin isn’t updated. Costs and prices change, but control numbers stay the same for months — the breakeven boundaries quietly drift away from reality.
Algorithm: setting your own Google Ads rules before launching a campaign
The step-by-step process we run with a client before launch, or before auditing an existing campaign:
- Take your average order value from the last 3–6 months (not from one lucky month).
- Calculate your real margin — including product cost, logistics, and all direct costs, not just markup.
- Calculate your lead-to-customer conversion rate from historical CRM data (for a new campaign, use a conservative industry estimate and adjust after the first 20–30 leads).
- Calculate the maximum customer price and maximum lead price using the formulas above.
- Set the decision checkpoint — maximum lead price × 3.
- Write these numbers down — in the brief, a spreadsheet, or a report — before the campaign launches, so the evaluation doesn’t depend on mood or deadline pressure.
These same three numbers — maximum lead price, maximum customer price, and the 3x decision checkpoint — form the basis of every Google Ads financial audit we run for clients across Europe.
FAQ: Google Ads rules
What’s a normal cost per lead on Google Ads?
There’s no universal figure. A “normal” cost per lead is your maximum lead price, calculated as “average order value × margin × lead-to-customer conversion rate.” For one business the number will be €5, for another €50, depending on order value and margin.
How long should you give a new Google Ads campaign before judging results?
Judge by spend, not by calendar days: the decision checkpoint arrives once spend reaches three times the maximum lead price (the 3x rule). Depending on daily budget, that can be 3–14 days.
What should you do if a campaign exceeds its budget limit with no leads?
First check whether the problem is with clicks (low traffic, expensive clicks) or with site conversion (traffic is there, no leads). If one optimisation cycle brings no result, reallocate budget to campaigns that are already profitable and revisit the test later with different hypotheses.
Can you judge a campaign by CTR and cost per click alone?
No. CTR and CPC show how appealing and competitive an ad is in the auction, but say nothing about profitability. A campaign with a high CTR and a cheap click can be loss-making if traffic doesn’t convert into leads at an acceptable price — and vice versa.
Do test campaigns need their own rules?
Yes. A test budget should be capped in advance (e.g. 10–15% of total budget) and judged by looser criteria — but without a cap, a “test” turns into uncontrolled spend disguised as hypothesis testing.
Want to check whether your current campaigns meet their own breakeven rules? Request a free Google Ads audit from Spilno Agency.

Read also

Google Tag Manager Workspaces: Why You Need Them and How to Use Them in 2026
A workspace in Google Tag Manager is a “draft” of a container — a place to safely edit…
How to Track Revenue, Transactions and Purchases in Google Analytics 4 from WordPress WooCommerce
Introduction WooCommerce store owners are often convinced that Google Analytics 4 already shows them revenue, transaction counts and…
How to Analyze Hourly Statistics in Google Analytics 4
Google Analytics 4 has no dedicated “hourly statistics” menu item, but you can get that exact breakdown in…