Google Data Studio (Looker Studio): What It Is and What It Can Do


Looker Studio (formerly Google Data Studio) is a free business-intelligence tool from Google that turns data from Google Ads, Google Analytics 4, Search Console, Google Sheets, and over 800 other sources into interactive dashboards — no code required. We break down what changed after the 2022 rename, how data sources and connectors work, and show concrete use cases for marketers, Google Ads specialists, paid-social managers, SEO specialists, and social media managers — plus a step-by-step guide to building your first dashboard.
What Is Google Data Studio (Looker Studio)
Looker Studio is a free data-visualization and business-intelligence platform from Google. It connects to data sources — an ad account, a Google Sheets spreadsheet, an analytics property — and turns raw numbers into charts, tables, and graphs that refresh automatically, without manually exporting data and pasting it into a slide deck.
The product launched in 2016 as Google Data Studio, part of the Google Marketing Platform suite. In October 2022, Google moved it under the Looker brand — the enterprise-grade business-intelligence platform it had acquired in 2019 — and renamed it Looker Studio. The name and logo changed; the free plan stayed, alongside a new paid tier for teams, Looker Studio Pro.
The core idea is “connect once, forget about it”: a dashboard set up once pulls fresh data from its source every time it’s opened, so marketers and clients alike don’t need to manually rebuild a spreadsheet report every week.
Key Features of Looker Studio
- 800+ data source connectors — from Google Ads and Google Analytics to CRM systems and SQL databases.
- Data blending across multiple sources — for example, Google Ads spend and GA4 conversions on the same chart.
- Calculated fields — custom metrics and formulas like
CTR,ROAS, orcost per leadthat don’t exist natively in the source. - Ready-made templates — a gallery of reports for a specific channel (Google Ads, GA4, SEO, social media) you can copy and connect to your own data in minutes.
- Interactive controls — date, campaign, or device filters the viewer can operate directly in the report, without contacting an analyst.
- Sharing and publishing — view-only links, website embedding via iframe, and scheduled PDF email delivery.
- Client branding — colors, fonts, and a client’s or agency’s logo built right into the dashboard.
How Looker Studio Works: Data Sources and Connectors
Every Looker Studio report starts with a data source connection. Each data source is a reusable object you can plug into multiple reports without reconnecting from scratch. The most common data sources for digital marketing:
| Data source | Connector type | What it shows |
|---|---|---|
| Google Analytics 4 | Native, free | Traffic, conversions, and user behavior by channel |
| Google Ads | Native, free | Spend, clicks, CTR, and conversions by campaign and keyword |
| Search Console | Native, free | Rankings, impressions, and CTR for organic search by query and page |
| Google Sheets | Native, free | Any manual or imported data — budgets, plan-vs-actual, offline sales |
| BigQuery | Native, free (GCP query costs apply) | Large datasets, custom SQL queries, raw GA4 event data |
| Meta Ads, TikTok Ads, LinkedIn Ads | Partner connector (Supermetrics, Windsor.ai, etc.) | Ad spend and performance outside Google’s own ecosystem |
Native Google connectors are free with no account limits. Partner connectors for social platforms run through a separate middleware service, which typically has a free tier (a handful of data sources) and paid plans for higher volume — worth factoring in early if you’re planning a dashboard covering several ad accounts.
Looker Studio for Marketers
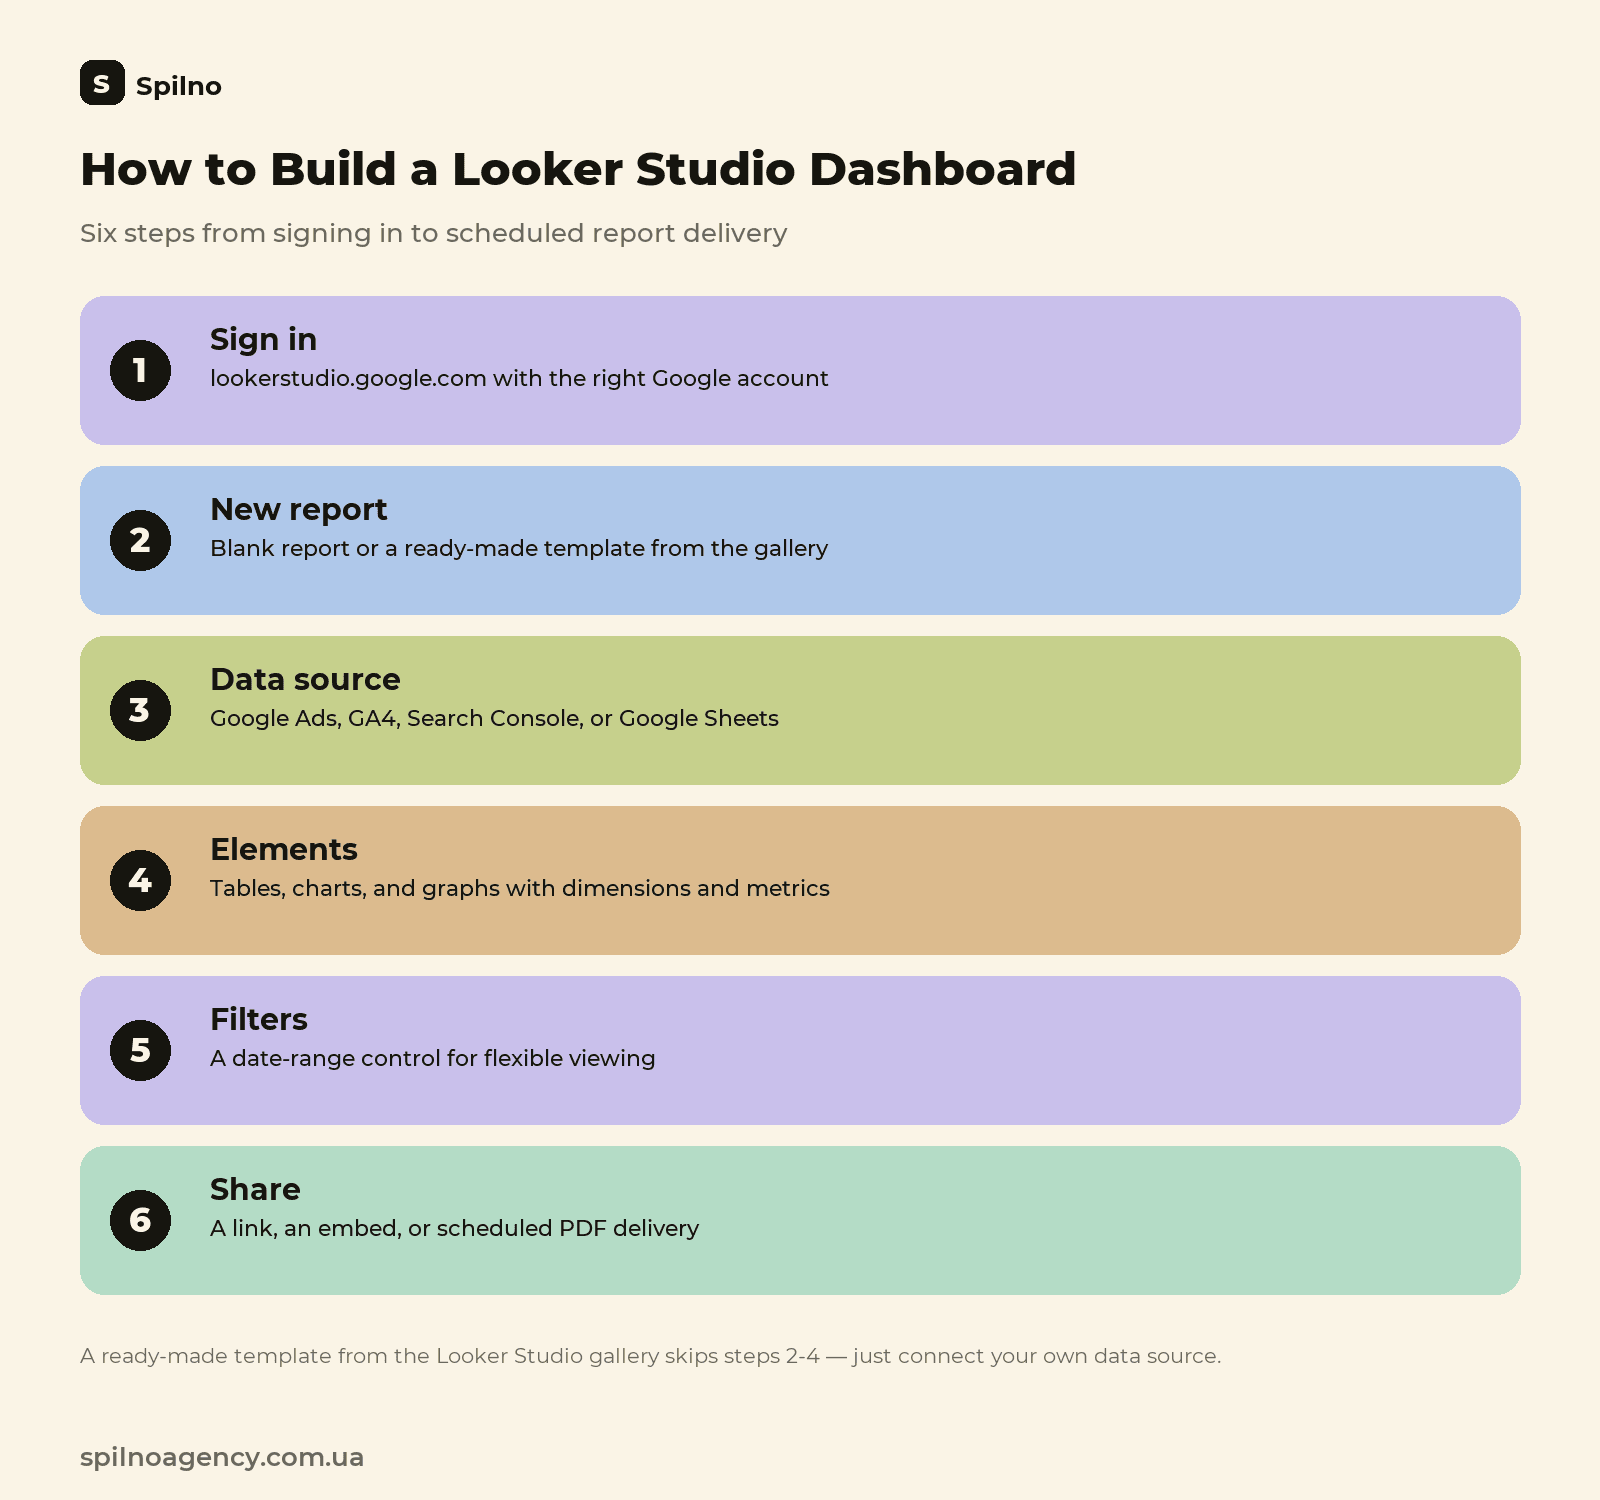
For a marketer, the core value of Looker Studio is a single consolidated dashboard that pulls every channel together, replacing the weekly ritual of copying numbers from Google Ads, Meta Ads Manager, and Google Analytics into a spreadsheet. A typical setup: one report with date and channel filters showing total spend, leads or sales, cost per lead by traffic source, and day-over-day trends.
The second common use case is client reporting. Instead of a manually built slide deck once a month, a marketer sends the client a link to a live dashboard, or schedules an automatic PDF delivery every Monday. That saves hours of routine report-building and immediately builds client trust — the numbers are always current, not “as of last week.”
Looker Studio for Google Ads Specialists
The standard Google Ads interface is fine for one account over one period, but awkward for comparing several campaigns over time or working with a client who has no access to the account itself. Looker Studio solves both:
- Automated campaign reports instead of manually exporting a CSV from Google Ads every week.
- Period-over-period comparisons (week-over-week, month-over-month) in a single chart without switching date ranges in the platform.
- Custom performance metrics — for example, calculating ROAS or cost-per-lead including offline conversions from Google Sheets that the standard Google Ads interface doesn’t account for.
- A client dashboard with no account access required — a public link showing results, with no ability to change bids or budgets.
If you’re managing a client’s ads and don’t have direct account access yet, it’s worth reading what to do when a freelancer or agency won’t hand over Google Ads access — without stable account access, connecting a Looker Studio connector won’t work either.
Looker Studio for Paid Social / Targeting Specialists
A paid-social specialist running Meta Ads, TikTok Ads, or several ad accounts outside Google’s ecosystem connects them to Looker Studio through partner connectors (Supermetrics, Windsor.ai, Funnel, and others). This produces cross-platform reporting in one report — for example, comparing cost per lead between Meta and TikTok on the same chart, something neither native ads manager shows on its own.
Another common scenario: an agency or freelance paid-social specialist manages several clients at once and doesn’t want to log into each Ads Manager separately to pull numbers. One dashboard template with a “client/account” filter lets you switch between projects in seconds and see every campaign in the same format, regardless of how different each ad platform’s own interface looks.
Looker Studio for SEO Specialists
Search Console is the primary source of SEO data, but its built-in interface caps history at 16 months and limits how granular you can get across pages and queries at the same time. Connecting Search Console to Looker Studio gives an SEO specialist:
- Ranking and traffic trends by query cluster over a longer period than the GSC interface allows.
- Organic traffic comparisons by page before and after on-page changes.
- Combined Search Console and Google Analytics data in one report — for example, which organic queries actually convert into leads, not just clicks.
- A client dashboard without granting access to the underlying Search Console property — useful when an agency manages SEO for several sites at once.
Looker Studio for Social Media Managers
Organic social (with no ad spend behind it) rarely has a convenient built-in reporting dashboard, so social media managers usually pull numbers manually from Meta Business Suite, TikTok Analytics, or Instagram Insights. Through partner connectors, that data can feed into Looker Studio to build a report with reach, engagement rate, follower growth, and performance comparisons between individual posts or Reels over a period — for more on that content format, see our guide on UGC content, which often goes hand in hand with organic social reporting.
For a content calendar, this makes it much easier to show a client the value of the work: instead of screenshots of stats from each platform separately, one dashboard with monthly trends and a comparison of which topics or formats are performing better.
How to Build Your First Looker Studio Dashboard: Step by Step
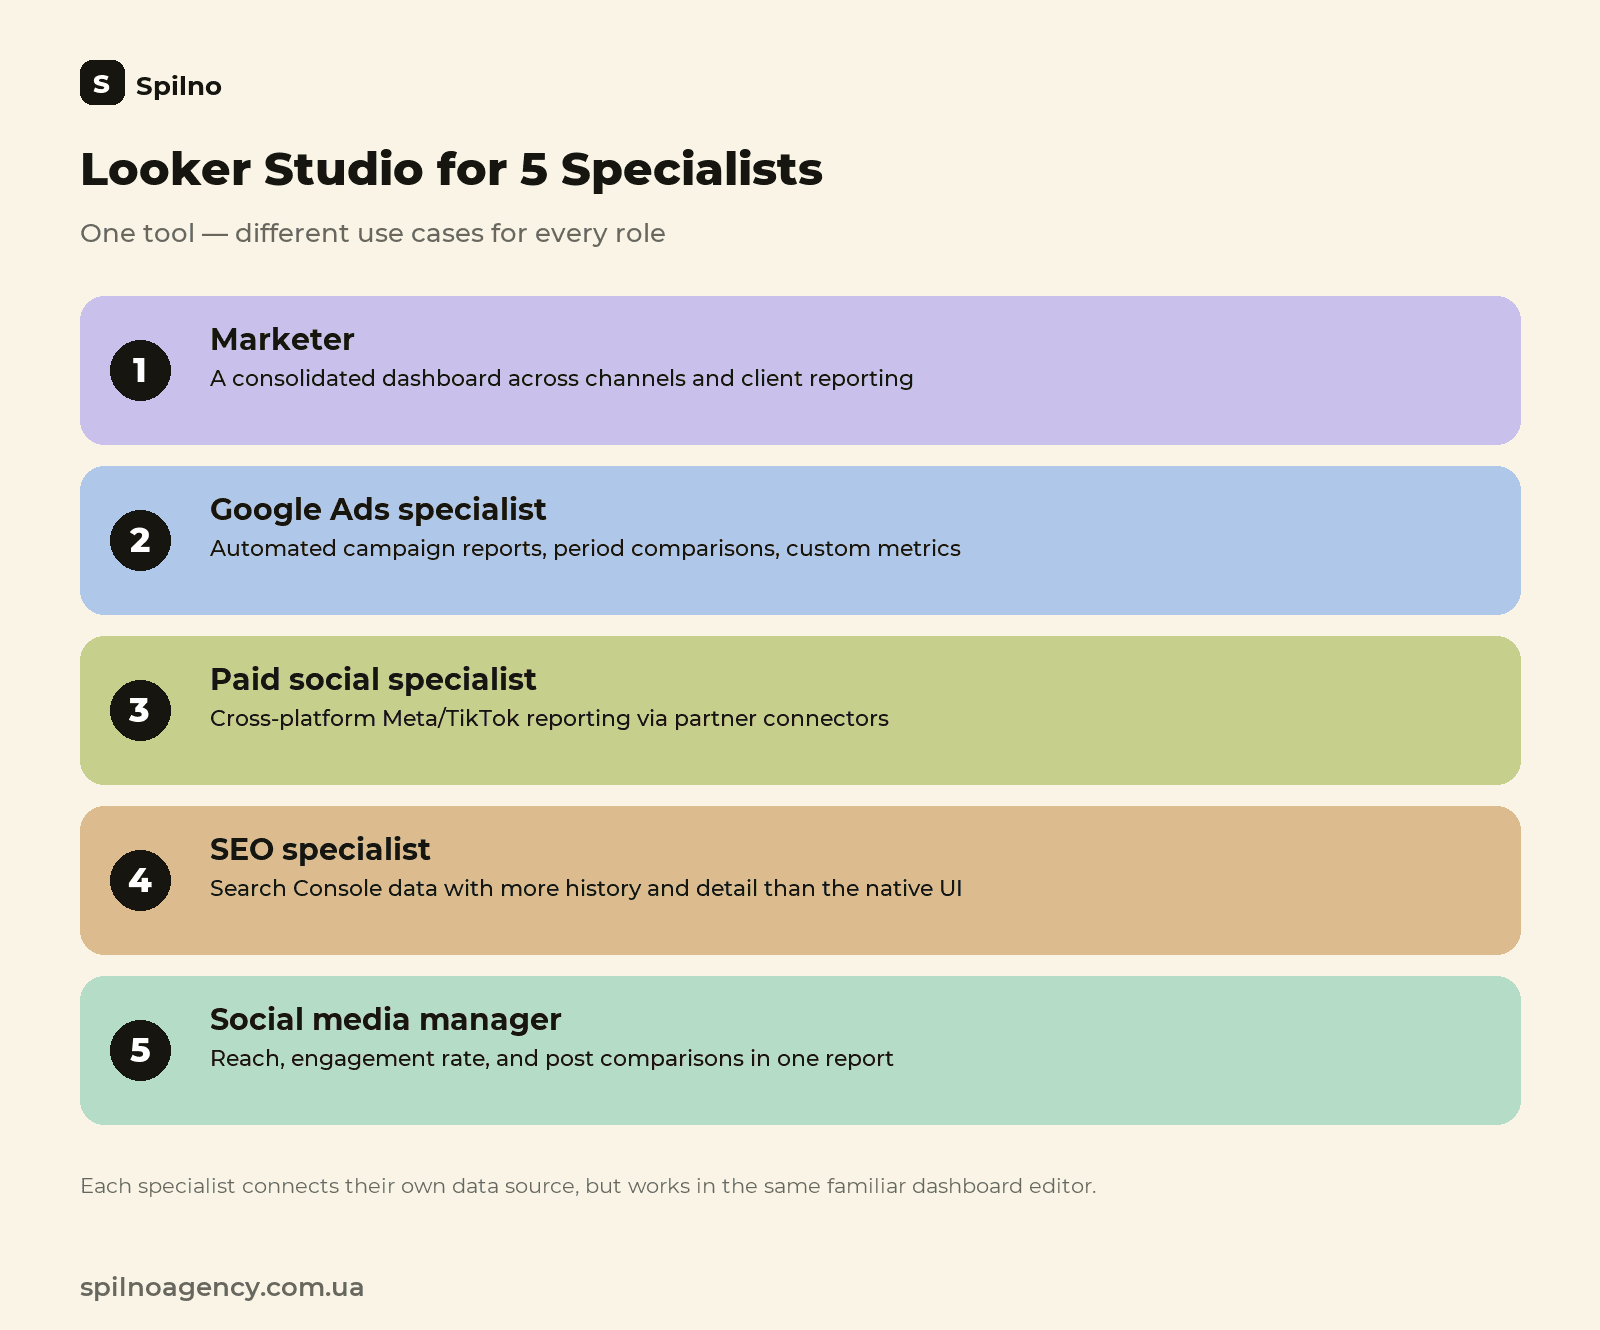
- Go to lookerstudio.google.com and sign in with the Google account that has access to the data sources you need (Google Ads, GA4, and so on).
- Create a new report — click “Blank Report,” or pick a ready-made template from the gallery if you’d rather not build the layout from scratch.
- Connect a data source — choose the right connector (Google Analytics 4, for example), authorize access, and select the specific account or property.
- Add your first elements — drag a table, time-series chart, or graph from the toolbar onto the canvas and assign dimensions and metrics (for example, “Traffic source” + “Sessions”).
- Set up filters and controls — add a date-range control so you and the client can view different periods in one report without creating new copies.
- Share the report — use the “Share” button to grant view access to specific people, generate a public link, or schedule automatic PDF delivery by email.
Ready-Made Looker Studio Templates
If you don’t have time to build a dashboard from scratch, Looker Studio’s built-in template gallery (the “Templates” section on the homepage) has ready-made reports for specific sources — Google Ads, GA4, Search Console, or YouTube Analytics. Copy a template in one click, then simply switch the data source to your own account — the chart layout, colors, and filters are already in place.
Looker Studio Pro: What the Paid Tier Adds
| Feature | Looker Studio (free) | Looker Studio Pro |
|---|---|---|
| Number of reports and data sources | Unlimited | Unlimited |
| Access management via Google Cloud/IAM | No | Yes |
| Transfer report ownership without breaking the link | No | Yes |
| Google technical support (SLA) | No | Yes |
| Pricing | Free | Monthly per-user fee (Google Cloud billing) |
For most marketers, freelancers, and small agencies, the free version is enough. Looker Studio Pro makes sense once dashboards become critical infrastructure for a larger team and you need centralized access management through Google Cloud rather than individual staff accounts.
Common Looker Studio Mistakes
- Cramming too many metrics onto one screen. A dashboard with 20 charts is hard to read — split it into several tabs by topic (traffic, conversions, ads).
- A data source tied to a personal account. If the dashboard is connected through a specialist’s personal Google account rather than a shared or service account, the report breaks the day that person loses access to the source.
- Ignoring the data cache. A dashboard that looks “stuck” on old numbers is usually just waiting on its cache to refresh — check the refresh interval in the data source settings before assuming the connector is broken.
- No date-range control. Without one, you end up creating a separate copy of the report for every new period instead of letting the client pick their own range.
Alternatives to Looker Studio
Looker Studio isn’t the only business-intelligence tool, but it’s the only one that integrates natively with Google’s ecosystem for free. The main alternatives for more complex enterprise scenarios are Microsoft Power BI (deeper Excel and Azure integration, paid from the start) and Tableau (more powerful visualization, a steeper learning curve and price tag). For digital marketing, where the core data sources are Google Ads, GA4, and Search Console, Looker Studio usually covers the job without paying for a separate BI tool.
For more on how Google keeps evolving reporting inside Google Analytics itself, alongside Looker Studio, see our news piece on Google Analytics’s redesigned dashboards — one-click dashboard creation straight from the Reports section.
Looker Studio: Frequently Asked Questions
Are Looker Studio and Google Data Studio the same thing?
Yes — Google renamed Google Data Studio to Looker Studio in October 2022 after integrating it with the Looker platform. The functionality and free plan stayed the same.
Is Looker Studio free?
Yes, the core version is completely free — unlimited dashboards and connections to standard data sources. The paid Looker Studio Pro tier is mainly for larger teams that need access management through Google Cloud.
What data sources can you connect?
Over 800 connectors — from native Google products (GA4, Google Ads, Search Console, BigQuery) to partner connectors for Meta Ads, TikTok Ads, CRM systems, and SQL databases.
Do you need coding skills?
No, a basic dashboard only needs the drag-and-drop interface and ready-made templates. Advanced calculated fields benefit from Excel/Google Sheets-style formula knowledge.
How often does the data refresh?
It depends on the source’s cache setting — 12 hours by default for most Google connectors, adjustable in the data source settings.
How is Looker Studio different from GA4’s built-in reports?
GA4 reports only show Google Analytics data with limited customization. Looker Studio combines several sources in one dashboard and lets you share a report without granting access to the underlying accounts.

Read also
Instagram: What Are Reels and How to Use Them
Reels are short vertical videos on Instagram that the algorithm shows even to non-followers. Technical specs, how Reels…
UGC Content: What It Is and How to Use It in 2026
UGC content is reviews, unboxings, and videos made by real people. Types of UGC, what a UGC creator…
Lead Generation: What It Is and How It Works in 2026
Lead generation is how businesses attract potential customers. Lead types, inbound vs outbound, 2026 channels, lead scoring, and…