How to Control an SEO Specialist: The 5-Stage SEO KPI Funnel

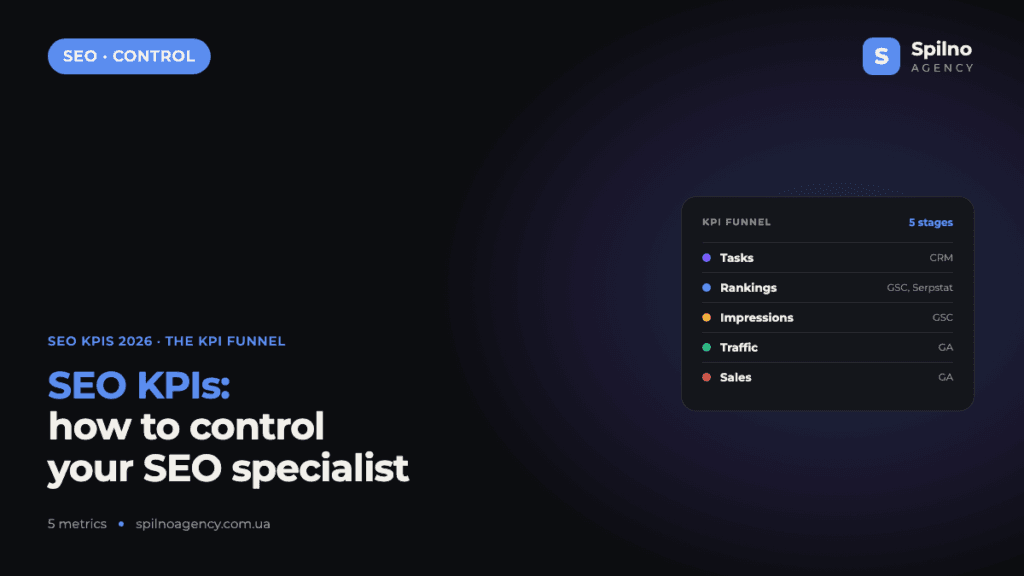
SEO KPIs form a chain of five metrics that show, step by step, whether your SEO is actually working: tasks → rankings → impressions → traffic → sales. Each metric depends on the one before it, so the moment the chain breaks somewhere, you can see exactly at which stage the problem sits — and whose problem it is (the specialist’s, the site’s, or the product’s own). This guide breaks down each SEO KPI in detail: where to find it, and what to do if it stops growing.
Why “trust” isn’t a way to control SEO
SEO is the one digital marketing channel where results don’t show up immediately — it typically takes 1–3 months after changes go live. Because of this delay, many business owners end up controlling their SEO specialist “on faith”: if the report looks good, everything’s fine; if it doesn’t, something’s wrong. This doesn’t work either way. A diligent specialist looks inactive in the first month of work, while a weak one can hide for months behind a nicely worded report of “completed tasks” that don’t move anything.
The solution is to control not the process, but the chain of metrics that can’t be faked with words in a report. It’s the same principle behind any proper SEO audit: start with raw data from Google Search Console, Google Analytics and your CRM, and only then look at the specialist’s interpretation of it.
The SEO KPI funnel: 5 metrics that show the whole path
SEO works like a funnel: the specialist completes tasks, tasks lift rankings, rankings generate impressions in search results, impressions convert into traffic, and traffic converts into sales. The metrics follow strictly in sequence — you can’t get sales without traffic, traffic without impressions, or impressions without rankings. That’s why, when a metric stalls, you don’t look at the whole project at once — you look at the specific link in the chain that comes right before it.
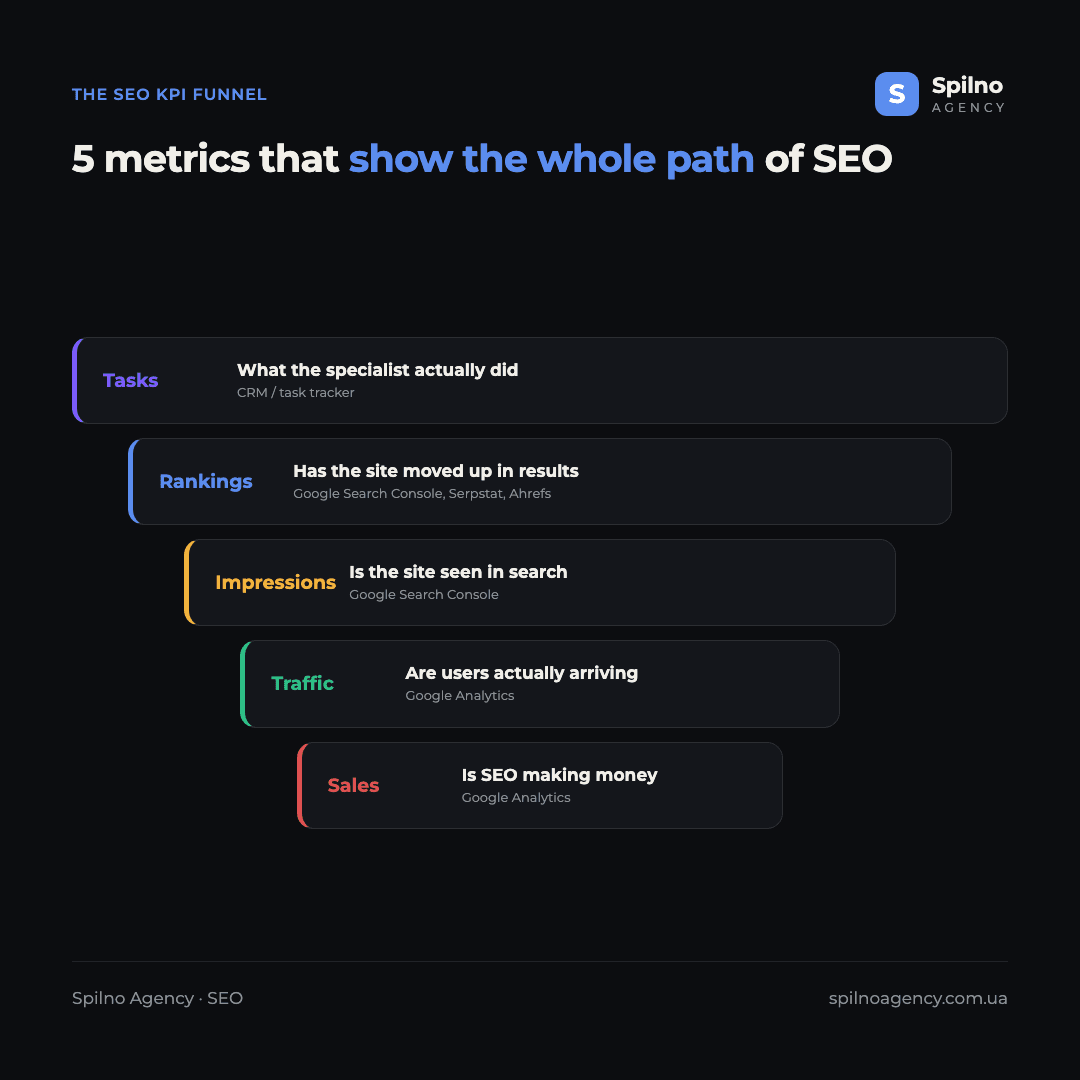
| KPI | Where to measure it | If the metric isn’t growing |
|---|---|---|
| Tasks | Specialist’s CRM / task tracker | Tasks aren’t being completed, or don’t actually affect the site |
| Rankings | Google Search Console, Serpstat, Ahrefs | Tasks are completed but haven’t moved rankings |
| Impressions | Google Search Console | Rankings aren’t improving, or aren’t in the top results |
| Traffic | Google Analytics | Traffic-driving queries aren’t in the top 15 / 10 / 5 / 3 / 1 |
| Sales | Google Analytics | Traffic is untargeted or converts poorly |
Looking for the full list of SEO metrics and benchmark values instead? See our guide to core SEO KPIs to track. This guide focuses specifically on the control process — the 5-stage KPI funnel below.
KPI 1. Tasks — what the specialist actually did
The first and most basic level of control is completed tasks: technical fixes, page optimisation, link building, content work. It’s measured in the CRM or task tracker the specialist uses to run the project: every task should have a status, a deadline, and ideally an expected impact on a specific page or keyword cluster.
What it affects: tasks are the cause, every metric further down the funnel is the effect. If there are no tasks, or they haven’t been completed for months, there’s no point looking further down the funnel for the problem — the chain already breaks at the very first step.
Where to look for the problem: compare the monthly task plan against what was actually closed. If tasks are being closed but the metrics further down the funnel aren’t moving, the question isn’t “is the specialist working” but “are these the right tasks”. A technical fix on a page outside your priority keyword cluster will still show up as a “completed task” in the report, but it won’t move a single metric.
KPI 2. Rankings — has the site moved up in search results
Rankings are where the site sits in Google’s organic search results for target queries. The main data source is Google Search Console (real data straight from Google’s own search results); rank-tracking tools such as Serpstat or Ahrefs are used alongside it. Numbers from different sources can vary slightly because of differing collection methods — focus on the trend rather than the exact figure from any single tool.
What it affects: rankings are the bridge between the specialist’s work (tasks) and the site’s visibility to users (impressions). This is the first metric where you actually see the real effect of technical and content changes — but with a delay for re-indexing and re-ranking, so evaluating rankings any sooner than 3–4 weeks after implementing changes doesn’t make sense.
Where to look for the problem: if tasks are being completed but rankings aren’t moving, check whether the changes actually landed on the target keyword cluster, whether Google has re-indexed the updated pages (Google Search Console → URL Inspection), and whether a technical issue is quietly eating the effect (duplicate content, canonical tags, page speed).
KPI 3. Impressions — is the site actually being seen in search
Impressions are how many times the site appeared in Google’s search results for any query, regardless of whether the user clicked or not. This is measured exclusively in Google Search Console — it’s the only source that sees the actual results Google itself is serving.
What it affects: impressions measure reach. Even if the ranking for a given query isn’t high (say, positions 30–50), the page is already appearing in search results and racking up impressions — this is the groundwork stage before traffic starts to grow.
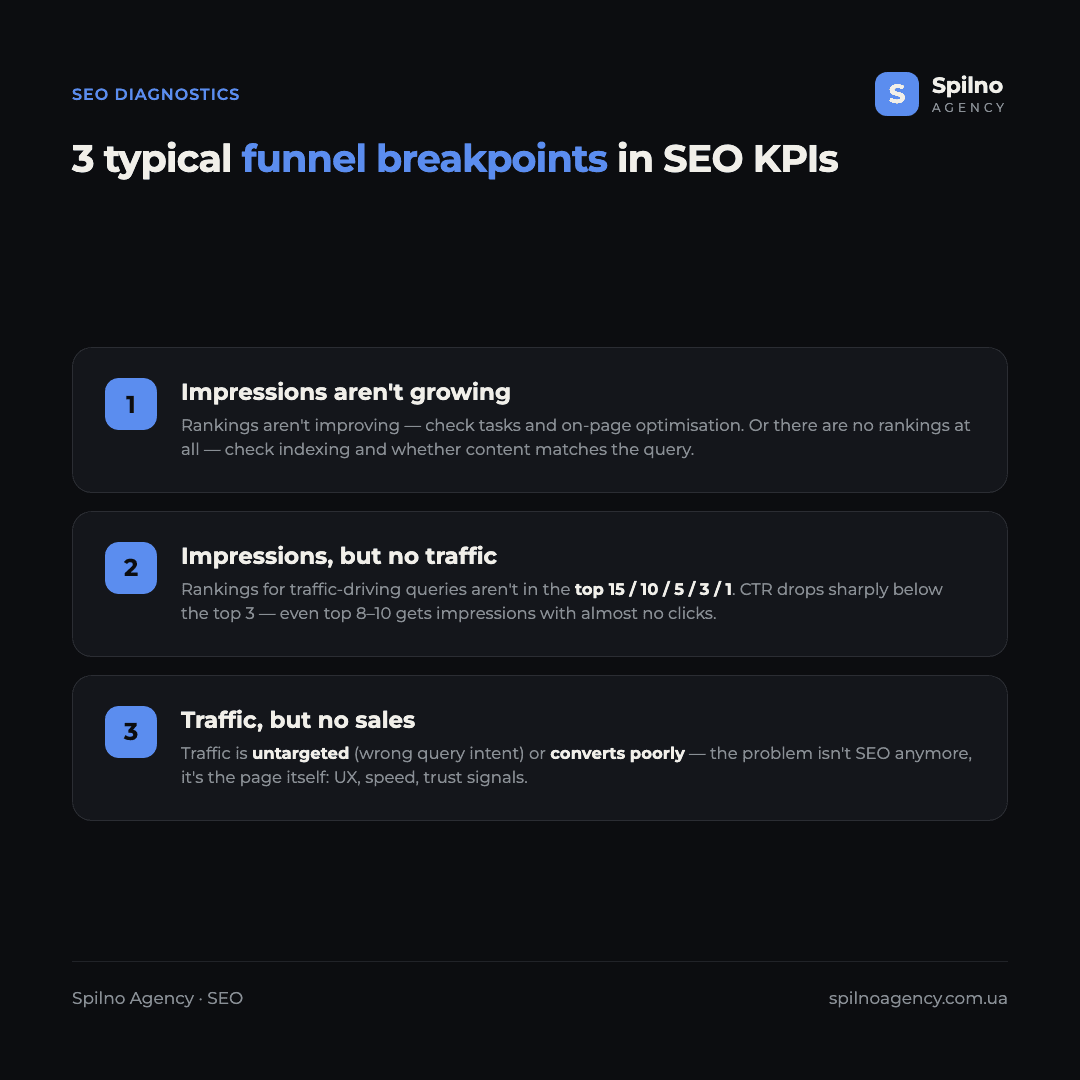
Where to look for the problem if impressions aren’t growing:
- Rankings aren’t improving. The site is already showing up in search results but is stuck in the same positions — look for the cause under the “Rankings” KPI above.
- There are no rankings at all. The page isn’t ranking for its target queries — check indexing (is the page in Google’s index), whether the content matches search intent, and whether the query even appears in the page’s on-page keyword set.
KPI 4. Traffic — are users actually arriving
Traffic is the number of real visitors who land on the site from organic search results. It’s measured in Google Analytics (the Organic Search channel). Unlike impressions, traffic requires more than just being present in search results — it needs a ranking high enough that users actually click through.
What it affects: traffic is the first metric in the funnel with direct business weight — these are real people on the site who go on to become leads and sales. If impressions grow but traffic doesn’t, it means the site is “visible” but not ranking high enough to actually get clicked.
Where to look for the problem if you have impressions but no traffic: there’s one main cause — rankings for the highest-volume, traffic-driving queries aren’t reaching the top 15 / top 10 / top 5 / top 3 / top 1. Organic click-through rate drops sharply with every position below the top 3, so even positions 8–10 can generate impressions with almost zero clicks. Check the “Performance” report in Google Search Console, broken down by position and CTR, for your cluster’s key queries.
KPI 5. Sales — is SEO actually making money
The final metric in the funnel is sales (or leads, form submissions, calls — depending on your business model). It’s measured in Google Analytics through goals/conversions configured for the Organic Search channel. This is the metric SEO is ultimately commissioned to deliver — the previous four are all intermediate steps.
What it affects: sales show the direct return on SEO as a channel. But it’s the one KPI in the funnel that falls partly outside the SEO specialist’s control — it’s also shaped by the site itself (usability, speed, forms) and by the product itself (price, demand, reputation).
Where to look for the problem if you have traffic but no sales:
- The traffic isn’t targeted. The site is growing on queries that don’t match buyer intent — informational rather than commercial, for example. Check the keyword mapping: are the queries you’ve been optimising for actually landing on pages with a real offer?
- The traffic doesn’t convert, or converts poorly. People land on the right page but don’t submit a form — at this point the problem isn’t SEO anymore, it’s the page itself: UX, load speed, trust signals (reviews, contact details), and how well the offer matches the query.
How to measure SEO performance correctly
The biggest mistake in controlling SEO is judging results over a week, or even a month. SEO is a slow-moving channel: changes to the site take several weeks to be indexed and to affect rankings, and short time windows get heavily distorted by seasonality (holidays, sales periods, industry-specific demand cycles).
That’s why all five KPIs should correctly be measured over a window of at least 3 months. This doesn’t mean reporting only once a quarter — you can and should track the trend monthly — but conclusions about whether it’s actually working (“SEO is working” / “SEO isn’t working”) should only be drawn on a three-month horizon.
What to compare your SEO results against
Raw traffic or ranking numbers mean nothing without a baseline for comparison. The correct approach is to compare against two baselines at once:
- Year over year (YoY). The same 3 months a year earlier — this removes the effect of seasonality: if your niche typically dips in summer or winter, comparing against the same period last year shows the real trend rather than seasonal noise.
- Period over period (month-over-month / quarter-over-quarter). The last 3 months against the previous 3 months — this shows short-term momentum and how quickly the tasks that have been implemented are producing an effect.
If a metric is down both against the same period last year and against the previous quarter, that’s no longer seasonality — it’s a real problem worth tracing back through the KPI funnel above.
When to expect the first results
Realistic timelines along the funnel look roughly like this: the first movement in rankings appears 3–4 weeks after tasks are implemented, a noticeable rise in impressions follows in 4–6 weeks, traffic catches up with rankings with a small additional lag, and a stable trend in sales becomes visible within the three-month measurement window. If none of the five metrics has moved after 3 months, that’s a reason to break the funnel down step by step — not to wait out another quarter.
If you want to find out exactly where in the funnel your SEO is “stuck” — the Spilno Agency team can run a metrics audit and show you precisely where the result is being lost: in the specialist’s tasks, on the site, or in the product itself.

Read also
Best CMS for an Online Store: Cloud vs Self-Hosted Platforms in 2026
Compare Shopify, WooCommerce, PrestaShop, OpenCart and Magento for your online store. Pros, cons, and a step-by-step CMS selection…

LinkedIn Ads Library: How to Find Your Competitors’ LinkedIn Ads (2026 Guide)
How to use the LinkedIn Ads Library to see any competitor's sponsored content for free — step by…
Meta Ads Library: How to Find Your Competitors’ Facebook & Instagram Ads (2026)
How to use the Meta Ads Library to see any competitor's Facebook, Instagram and Threads ads for free…